1-Page Summary
In Blue Ocean Strategy, INSEAD business professors W. Chan Kim and Renée Mauborgne argue that the solution to business growth and success is to operate in an uncontested market. They use the metaphor of a blue ocean to represent an uncontested market, and they contrast it with a red ocean, a marketplace where fierce competition has stained the water with the blood of the combatants.
According to Kim and Mauborgne, crowded markets and red ocean strategies tend to produce minimal profit margins, while blue ocean strategies lead to more profitable growth.
In this guide, we’ll break down Kim and Mauborgne’s strategy for realizing your company’s blue-ocean potential into three key ingredients: innovation, strategic pricing, and successful execution.
1. Blue Ocean Innovation
Kim and Mauborgne assert that a blue ocean strategy starts with what they call “value innovation”—an innovation that makes your product so unique and superior to the competition (and thus more valuable to your customers) that you open up uncontested markets and leave your rivals behind. In this case, value is the benefit that your customers get for their money, while innovation is the uniqueness and originality of the benefit.
(Shortform note: In a similar vein, Seth Godin argues Purple Cow that only remarkable products are likely to succeed. He says that to be remarkable, a product must be both unique enough to stand out from the crowd, and also practical enough that people want to buy it. This is another way of looking at blue ocean innovation: It’s figuring out how to make your product unique enough in a good way that it stands out and people want it.)
How to Spark Blue Ocean Innovation
To create a blue ocean, Kim and Mauborgne say you need new ideas that redefine the market. They propose several approaches for brainstorming new ideas:
1. Consider Your Customer’s Alternatives
Kim and Mauborgne advise you to first consider the alternatives that your customer has, especially if they could achieve the same goal through different means. For example, rock-climbing gear and video games are different in form and function, but they fulfill the same basic goal of connecting with friends in a thrilling environment. Ask yourself if you could combine desirable features from different alternatives to provide unique value.
(Shortform note: It’s also worth considering what other goals a person could achieve with a product that is similar in form and function. In Crossing the Chasm, marketing consultant Geoffrey Moore defines alternate products that are different in form or function but achieve the same goal as market alternatives, and he contrasts them with product alternatives, which are similar in form or underlying technology but serve a different purpose. For example, an electric egg beater and an electric drill are used for completely different things, but they are made up of essentially the same components: an electric motor, a power supply, a gearbox, a coupling mechanism to hold the drill bits or beaters, and so forth. So, in addition to considering your product’s market alternatives as Kim and Mauborgne suggest, you might consider its product alternatives as well. Maybe you can create unique value by applying your product’s core technology to solve a different problem.)
2. Consider How Customers Weigh Price Against Performance
Kim and Mauborgne ask you to consider what characteristics motivate your customers to buy higher-quality products at higher prices versus lower quality at a lower price. Ask yourself if you can create a unique offering by focusing on the characteristics they are willing to pay extra for and eliminating the others.
(Shortform note: As you evaluate this, it may be helpful to rank your product and its features according to their technological maturity—the extent to which they’ve been proven. Then consider offering a premium model with all well-proven features, or an inexpensive minimalist model with only cutting-edge experimental features. This is potentially advantageous because technological maturity is one characteristic that often influences whether customers gravitate toward higher-priced or lower-priced models, as explained by marketing consultants Al Ries and Jack Trout in their book Positioning. They assert that people more readily embrace budget versions of new technology, because this allows them to try it out without risking as much money on it, but if the technology is mature, they are more receptive to premium versions.)
3. Consider Other Buyers in the Chain
Kim and Mauborgne suggest appealing to under-served people in the purchasing chain. If the end user and the person with purchasing power are not one and the same, the end user may have pain points, or persistent problems, you can address to provide unique value.
(Shortform note: Moore differentiates between three types of buyers: The economic buyer is the person who pays for the product or authorizes the purchase. The technical buyer is the person who sets up the product so it can be used. The end user, or functional buyer, is the person who uses the product once it’s set up. Each of these three may have their own unique pain points.)
4. Consider Complementary Products
Kim and Mauborgne note that products are rarely used in isolation. Consider what happens before, during, and after your product is used. Ask yourself if there’s friction between any of these handoffs that you could alleviate to create unique value. It might be as simple as bundling complementary products with yours.
(Shortform note: A key element of Moore’s strategy is assembling the “whole product.” Similar to Kim and Mauborgne’s observation, Moore points out that your core product offering typically only provides part of the whole solution that the customer needs, and he recommends forming alliances with other companies who can provide the other pieces of the puzzle.)
5. Consider Adding Function or Emotion
Kim and Mauborgne observe that most industries tend to gravitate toward either functionality or emotion. Consider making an emotional industry more functional by stripping away unnecessary extras, or making a functional industry more emotional.
For example, cosmetics tend to lean heavily toward emotion: They are designed and marketed to make customers feel beautiful. Meanwhile, house paint leans more toward function: It is designed to provide objective benefits like durability and the ability to match an existing color. But what if you took a more objective, “house paint” approach to selling cosmetics by citing a benefit such as being long-lasting? Or what if you created a line of “cosmetic” house paint that (together with your advertising) made homeowners feel better about themselves and their homes for using it?
(Shortform note: Be careful not to strip away too much emotional quality of your product—sales expert Oren Klaff argues that to pitch a product successfully to a prospective customer, you must appeal to the primitive, emotional side of the brain first. If you try to be too rational up front, the emotional center of the brain will filter out your message and it will never actually reach the rational part.)
6. Consider the Impact of Trends
If you can identify relevant market trends that have a clear direction, the authors advise you to consider what the market will look like if the trend is taken to its logical conclusion. Then assess how you could provide unique value to the new markets the trend creates.
(Shortform note: Trends analyst David Mattin argues that there is a simple key to understanding trends so that you can use them to your advantage in business: Instead of focusing on how things change over time, learn what doesn’t change. Understanding constants like human nature allows you to predict how new developments will play out.)
7. Consider the Needs of Potential Customers
Kim and Mauborgne advise you to reach beyond existing demand and include people who are not currently customers but may become so in your assessment. If you can solve a problem that is preventing people from buying products in your industry, you may create a blue ocean of new demand from both within and outside the traditional boundaries of the industry.
(Shortform note: Expanding your market to potential customers is also a key element of Moore’s strategy, but he presents it as a phased process: First you target a niche market, then as your product dominates that niche and gains credibility as the market leader there, you expand into another adjacent niche and repeat the process.)
How to Visualize Blue Ocean Innovation
To help visualize your strategy and see whether it provides unique value, Kim and Mauborgne introduce the blue ocean strategy chart, a graphic tool that they also call the “strategy canvas.” It consists of a two-dimensional line graph:
- On the horizontal axis, you list the characteristics of competition, that is, the attributes of your product.
- The vertical axis represents the value or emphasis you place on each characteristic.
Kim and Mauborgne explain that you plot the value of each characteristic on the graph as a point, and connect the points to create a strategy curve, which is essentially the path that your product follows across the various attributes. You do this both for your product (or prospective new offering) and its leading alternatives.
For example:

(Shortform note: Kim and Mauborgne’s strategy chart echoes the business trend of presenting business strategies succinctly on one sheet, such as an A3 Sheet, Business Model Canvas, or Lean Canvas. However, only the blue ocean strategy graph presents its information visually, which makes it more user-friendly—the other presentations require the user to read carefully through a lot of text and mentally evaluate how their product differs. For this reason, many find the blue ocean strategy chart easier to use.)
Kim and Mauborgne point out that if your product’s path closely follows another product (like Product X and Product Y in our example graph) then you’re not providing unique value—you’re applying a red-ocean strategy to compete directly with existing products. For a blue ocean strategy, you want your strategy curve to diverge significantly from every other company’s.
(Shortform note: Ries and Trout suggest that sometimes you can create unique value without changing the product itself just by identifying what makes your offering unique and showing customers why these differences are significant through advertising. For example, perhaps your product is just a little smaller than any of the others on the market, so you market your product as the only offering of its kind for children. If your marketing is successful, you’ve created a new characteristic (child friendliness) on the strategy chart without changing the product itself at all.)
The authors also note that if your curve is very flat, your offering may not be focused enough: You’re trying to be all things to all customers, and you’ll end up being a poor alternative for all of them.
(Shortform note: Ries and Trout likewise observe that appealing to a specific audience is crucial for successfully marketing a product, and add the nuance that maintaining this focus can be psychologically difficult because it’s counterintuitive: To target a specific market sector, you have to give up targeting other sectors, so you’re targeting fewer customers in order to make more sales. This counterintuitiveness makes it easy to make the mistake of trying to be everything to everyone.)
2. Strategic Pricing
You’ve got a product that provides unique value, but to benefit from this blue ocean, you need to price it right. Kim and Mauborgne recommend a three-step process for selecting your price and ensuring the profitability of your blue ocean.
(Shortform note: In Crossing the Chasm, Moore identifies three basic pricing strategies, which provide useful context for this discussion: Customer-oriented pricing is when you set your price based on how much value your product provides to the customer and what they’ll likely expect, given their alternatives. Vendor-oriented pricing is where you set your price based on your own costs and desired profit margin. Distributor-oriented pricing is where you set your price to motivate your distributors by making your product the most profitable thing for them to sell.)
Step 1: Identify Your Price Range
Kim and Mauborgne recommend cataloging the price of your customers’ alternatives and using this data to establish a range of prices that will be competitive with these alternatives. They say this will help to maximize your customer base, and thus your revenue.
The Advantage of Distrubutor-Oriented Pricing
>
This is what Moore would call “customer-oriented pricing” (setting prices based on value to the customer or customer expectations). Moore, however, doesn’t advise that you use customer-oriented pricing, but instead advocates for distributor-oriented pricing, which is pricing your product such that it is the most profitable thing your distributor can sell, so that your distributor is motivated to go the extra mile when it comes to pushing your product.
Note that Moore developed his strategy for Crossing the Chasm specifically for high-tech business-to-business products, where the distributor often plays a crucial role in adoption: A leading vendor in a given industry can give a new product instant credibility by choosing to distribute it. Because this pricing model applies to such a specific situation, this method may not be useful for your product. However, Moore’s strategy may offer advantages in any venue where your distributor plays a particularly significant role in determining your sales volume.
Step 2: Choose a Price Within the Range
Once you’ve identified your price range, Kim and Mauborgne advise you to select a price in that range based on two characteristics:
- Defensibility: The harder it will be for your competitors to imitate your product (due to patent protection, trade secrets, or other unique advantages that your company has) the higher you can set your price.
- Scale: The greater the economies of scale (how much the cost per unit decreases with increasing volume) and the greater the network effects (how much the usefulness or attractiveness of your product increases as the user base grows), the lower you’ll want to set your price, to stimulate broad adoption.
(Shortform note: Arguably, scale is just part of defensibility, because the first-scalar advantage makes your product harder to imitate. If your product has significant network effects, in which having a large user base makes it more valuable to your customers, it will be harder for rivals to compete with you. Even without network effects, the larger your operation, the more expensive it is for others to replicate.)
Step 3: Manage Costs to Achieve a Profit Margin
Once you have your strategic price, Kim and Mauborgne advise you to calculate your target cost by deciding what profit margin you want and then applying it to your chosen price. They argue that you must not let costs dictate prices, nor should you lower your product’s benefits to match its costs, because doing so will jeopardize mass adoption. If you cannot reduce your costs to a level that allows for adequate profit, then they say your idea won’t work and you need to go back to the drawing board.
(Shortform note: Kim and Mauborgne’s directive to figure out your target price first and then manage your costs to achieve it could be considered a business application of Stephen Covey’s directive to begin with your goal in mind. Beginning with a clear understanding of the desired end-state (or in this case the retail price) allows you to chart a course to it and assess its feasibility more definitively.)
3. Execution
Now that you’ve got a strategy, it’s time to execute it. Kim and Mauborgne identify four hurdles that you’ll have to overcome to implement a blue ocean strategy at your company, and offer advice on how to overcome them.
1. The recognition shortfall: Before you can implement a blue ocean solution, you have to convince your stakeholders that there’s a problem worth solving. Arrange for them to meet dissatisfied customers, or otherwise bring them face to face with the problem, rather than relying on impersonal metrics.
(Shortform note: Make sure you’re personally familiar with the problem yourself too, so you can present your solution at a personal level, in a way that will serve your stakeholders’ best interests. According to Daniel Pink, this is one of the keys to effective selling.)
2. The capital shortfall: Kim and Mauborgne observe that companies in need of strategic change often have a resource shortfall. To work with this problem, the authors advise you to consider where your resources are earning the highest and lowest value per dollar spent, so that you can maximize your returns by shifting resources around.
(Shortform note: In The 48 Laws of Power, Robert Greene echoes this principle and generalizes it, saying that the key to moving forward is focusing on what will generate the greatest benefit. He applies this not only to physical resources but also to relationships and alliances.)
3. The initiative shortfall: Instilling in your team the motivation to make the change can be a hurdle in itself. Kim and Mauborgne advise breaking down your strategy into small, actionable blocks so the change doesn’t seem so daunting.
(Shortform note: In Tiny Habits, Dr. BJ Fogg proposes that the key to changing a person’s behavior is designing a change that’s small enough they don’t need tremendous motivation to change.)
The authors also emphasize the importance of making your strategy implementation a fair process in order to rally your team behind it. If your team members feel listened to and respected in the decision-making process, they’ll more likely go along with a decision even if they personally disagree with it.
(Shortform note: In Never Split the Difference, Chris Ross and Tahl Raz observe that people will often go out of their way to oppose anything they see as unfair, even if it means making irrational choices. This is what you are trying to avoid: If people perceive your blue ocean strategy as an unfair change in the direction of the company, they may reject it despite its merits.)
4. The cooperation shortfall: Kim and Mauborgne observe that organizations often have internal battles to get things done. They advise having one person on your strategic management team who knows the corporate politics from firsthand experience. Her function is to help you anticipate who will side with you or against you, understand the opposition, and mobilize support.
(Shortform note: In The 48 Laws of Power, Robert Greene emphasizes that knowing your opponents’ secrets allows you to predict their behavior and ultimately control them. He suggests that if you engage with people in a friendly, interested manner, in a social setting, they will often reveal their interests, plans, and even weaknesses. If you are too well-known as a supporter of the coming changes, and you suspect that opponents of the changes won’t open up to you directly, you need someone on your team who can socialize for you to find out how people really feel.)
Shortform Introduction
In Blue Ocean Strategy, W. Chan Kim and Renée Mauborgne argue that the solution to business growth and success is to operate in an uncontested market. They use the metaphor of a blue ocean to represent an uncontested market, and they contrast it with a red ocean, a marketplace where fierce competition has stained the water with the blood of the combatants. Their book provides a strategy for finding the blue ocean where your company can prosper.
About the Authors
W. Chan Kim is a professor of business strategy and international management at INSEAD. He is co-director of the Blue Ocean Strategy Institute within INSEAD and also a fellow of the World Economic Forum. Renee Mauborgne is Kim’s former student and now colleague at INSEAD. In 2019, Thinkers50 ranked them the #1 most influential thinkers in the field of business management.
The Book’s Publication
Blue Ocean Strategy was published in 2004 by the Harvard Business Review Press. It was the authors' first book and a culmination of their work on the subject of “value innovation,” some of which they published in scholarly articles between 1997 and 1999.
In 2017, they published a sequel titled Blue Ocean Shift, reiterating the central message of Blue Ocean Strategy and providing additional insight based on the experience of companies that applied the strategy since it was first published.
The Book’s Context
Historical and Intellectual Context
From about 1980 to the early 2000s, most influential writings on business strategy focused on competition. The authors credit Michael Porter and his book Competitive Strategy for ushering in this age of focus on competition, although many others contributed to it as well.
Against this backdrop, Blue Ocean Strategy represented a new direction in business strategy, focusing on developing uncontested markets instead of beating the competition.
However, many of the ideas it presented were not entirely new. In Positioning: The Battle for Your Mind (published in 1980) Al Ries and Jack Trout argued that the key to successfully marketing a product was to find or create an open market sector where your product would stand out as the clear leader. Functionally, this concept is very similar to Blue Ocean Strategy.
Similarly, in 1991, marketing consultant Geoffrey Moore published Crossing the Chasm, a strategy for introducing high-tech products into the mainstream market. Moore’s strategy could almost be considered a specific application of Blue Ocean Strategy to high-tech products.
However, despite their functional similarities, Moore and Kim presented their respective strategies using very different analogies: Kim and Mauborgne’s blue ocean metaphor emphasizes an absence of competition, while Moore illustrated his strategy using the D-Day invasion of World War II, focusing on the conflict of competition. The different metaphors reflect fundamental philosophical differences between the two strategies.
The Book’s Impact
Blue Ocean Strategy was well-received worldwide. It has sold more than four million copies and was listed among the best business books of 2005 by many influential publications, including The Wall Street Journal, Business Week, and Fast Company Magazine. It is rated 4.6 out of 5 stars on Amazon and 4 out of 5 on Goodreads.
Many reviewers praised the book for addressing the problem of fierce competition with a strategy that made sense and was well presented. The visual metaphor of bloody red oceans representing fiercely competitive markets contrasted with pristine blue oceans representing uncontested markets resonated powerfully with many reviewers.
The Book’s Strengths and Weaknesses
Critical Reception
Despite the overall positive reception of Blue Ocean Strategy, it was not without its critics. Critical reviewers often focused on the examples, saying they were merely anecdotes that were cherry-picked to provide an appearance of support for its principles. They asserted that there were no actual case studies of companies that had intentionally and successfully implemented the principles of the strategy.
Critics also pointed out that none of the ideas in the book were really new. Some reviewers went so far as to say that the only blue ocean the authors created was the one for their own book: They compiled well-known principles from the last 20 years of marketing strategy and rebranded it with a new visual metaphor that made them look superficially different from all the other market strategists of their day.
Our Approach in This Guide
Blue Ocean Strategy is organized into three parts (foundational principles, formulating your strategy, and executing your strategy). In this guide, we’ve reorganized content within the parts to group ideas more thematically.
Thus, in Part 1, we’ll discuss what constitutes blue ocean strategy according to Kim and Mauborgne, with additional perspectives from other business writers, such as Seth Godin.
In Part 2, we’ll explore the planning and analysis tools developed by Kim and Mauborgne and discuss their approach to discovering your company’s blue oceans. Again, we’ll augment Kim and Mauborgne’s perspective with reinforcing or contrasting perspectives from others, such as Geoffrey Moore, Al Rise, and Jack Trout.
In Part 3, we’ll discuss Kim and Mauborgne’s advice on how to execute blue ocean strategy in your organization, with additional tips from Adam Grant, Robert Greene, and others.
Part 1: What Are Blue Oceans?
In Blue Ocean Strategy, W. Chan Kim and Renée Mauborgne argue that the solution to business growth and success is to operate in an uncontested market, which they call a blue ocean, in contrast to a red ocean, a marketplace where fierce competition has stained the water with the blood of the combatants. They observe that much of the literature on business strategy focuses on red ocean strategies, that is, outperforming rivals to secure a greater share of a static market. However, they argue that red-ocean competition erodes profits so much that the key to building a successful business is to create a blue ocean.
(Shortform note: This spirit of direct competitiveness that Kim and Mauborgne’s theories grew out of is epitomized by an article by George Stalk and Rob Lachauer published the same year as Blue Ocean Strategy. In it, they argue that the key to success in business is crushing the competition, and they propose five strategies for doing so: Target your competitors’ “profit sanctuaries,” the products they make the most money on. Don’t hesitate to copy a good idea if you can get away with it. Use deception to prevent your competitors from figuring out your strategy. Attack only indirectly until you’re sure you can overwhelm your adversary. And find ways to trick your competitors into operating with lower profit margins.)
The Problem With Red Oceans
The authors contend that the red ocean mentality is based on the faulty premise of structuralism: the view that the market has a fixed structure that individual companies cannot change. In a fixed market, a company can only gain market share by taking it from someone else.
By contrast, Kim and Mauborgne take a “reconstructionist” view that markets are dynamic, demand-driven, and can often be reshaped by market players to expose new demand. If a company can create new market sectors for itself, it can profit from them without having to displace a competitor. As evidence for the reconstructionist perspective, the authors point to disruptive innovations such as the automobile and the personal computer, which created whole new markets.
Thus, blue ocean strategy focuses on creating new demand in uncontested market spaces, leading to profitable growth, because price competition is far less intense.
Disruptive Innovation and Market Reconstruction
In The Innovator’s Dilemma, Clayton Christiansen agrees with Kim and Mauborgne’s reconstructionist view that a disruptive innovation can shake up an industry’s very structure, and he outlines a few ways guidelines to keep in mind as you look to disrupt industry incumbents:
Disruptive innovations generally don’t come from your customers—if you let customer feedback drive your R&D, you’ll focus on minor improvements, and you’re more likely to be blindsided if your competitor makes a revolutionary breakthrough.
Incumbents usually want to build on existing products, improving them progressively, but revolutionary technologies require you to start over from basic principles rather than build on existing concepts.
Most established companies develop their strategies and make decisions based on market research, but you can’t do market research on a market that doesn’t exist yet. This is why incumbents often don’t see new markets developing.
Markets for disruptive innovations often start out too small to be relevant for big established companies, but they can grow so quickly that by the time the big company takes an interest in the new market, it’s too late for them to catch up with the startup that originated the technology.
The Benefits of Blue Oceans
Kim and Mauborgne assert that blue ocean strategies lead to more profitable growth. The authors studied business launches of 108 companies. They found that incremental extensions of existing markets accounted for 86% of launches but only 39% of profits. By contrast, 14% of launches created blue oceans, and they generated 61% of profits.
They note that they don’t have data on how many of the red ocean vs. blue ocean launches failed, but they argue that this is immaterial because any companies that failed would have low (or negative) profits, and that would bring down the overall profits that they reported for that category. Thus, even accounting for failures, blue ocean strategies produced more profits.
(Shortform note: Kim and Mauborgne don’t address the fact that averages such as this are very sensitive to outliers, meaning that just a few landmark successes on the blue ocean side could mathematically offset a large number of failures. Consequently, while the statistics they cite imply overall blue ocean success, the numbers might actually reflect a small number of (outsized) successes but a large number of failures as a whole. )
Innovation Is the Key to Blue Ocean Strategy
Kim and Mauborgne argue that a blue ocean strategy starts with what they call “value innovation”—an innovation that makes your product so unique and superior to the competition (and thus more valuable to your customers) that you open up uncontested markets and leave your rivals behind. In this case, value is the benefit that your customers get for their money, while innovation is the uniqueness and originality of the benefit. To be effective, value and innovation are both required. By contrast:
- Value creation without innovation tends to mean incremental improvements. For instance, decreasing costs and prices by 2% can create a lot of value, but it doesn’t lead to a new market space and differentiation.
- Innovation without value creation tends to create unique high-tech products that nobody wants to buy.
(Shortform note: Kim and Mauborgne coined the term “value innovation” in a 1997 article in which they explored the ideas that Blue Ocean Strategy was later based on—that companies must innovate beyond their currently defined borders in order to stay ahead of their competition. The term has been widely adopted by strategy and management experts since and is firmly associated with their theories.)
Typically, this “blue ocean innovation” involves adding value by creating new features that buyers want, while cutting costs by reducing or eliminating features they don’t care as much about, resulting in a unique offering. We’ll revisit this concept in Part 2, as we present tools and tactics for blue ocean innovation.
(Shortform note: In Purple Cow (published two years before Blue Ocean Strategy), Seth Godin argues that only remarkable products are likely to succeed, because people are bombarded with advertisements for so many unremarkable things that they’ve learned to ignore them. He goes on to clarify that to be remarkable, a product must be both unique enough to stand out from the crowd, and also practical enough that people want to buy it. This is nearly the same distinction that Kim and Mauborgne make in contrasting blue ocean innovation with “value without innovation” and “innovation without value.”)
What Blue Ocean Innovation Isn’t
The authors clarify that blue ocean innovation is not a matter of merely raising or lowering value in order to raise or lower your costs (which will then raise or lower the price you charge your customers). It’s easy to add premium features and offer a higher-value product at a higher price, or cut features to offer an economy version at a lower price, but that doesn’t require innovation. Instead, Kim and Mauborgne assert that you need a breakthrough that allows you to offer better value at lower cost.
To illustrate how a company can successfully implement a blue ocean strategy, Kim and Mauborgne discuss the Canadian company Cirque du Soleil (“Circus of the Sun”), which created a blue ocean for itself by redefining circus entertainment. They took some of the most popular types of circus acts, such as clowns and acrobatics, and wove these acts together with elements of theater into a coherent performance with a coherent storyline. At the same time, they eliminated traditional circus features like animal acts that were less important to customers and more costly to the circus. By doing so, they demonstrated the blue ocean innovation concept of focusing on what customers want and eliminating what they don’t.
Why Cirque du Soleil Is Iconic of Blue Ocean Strategy
The authors’ Cirque du Soleil case study has become particularly well known in connection with blue ocean strategy because it is such a good illustration of their concept of blue ocean innovation (or “value innovation”). By producing a show that was unlike any other, it provided unique value. Customers recognized this value and Cirque du Soleil quickly grew to become the global market leader of the circus industry (until they ceased operations due to the COVID-19 pandemic, declaring bankruptcy in 2020).
Furthermore, one thing that sets blue ocean strategy apart from other innovation-based business strategies is that blue ocean innovation doesn’t have to be technological innovation. Cirque du Soleil illustrates this principle because they were able to achieve a breakthrough in their industry without any new technology.
By contrast, other innovation-based strategies tend to assume that innovation produces a technological breakthrough. For example, in Crossing the Chasm, Geoffrey Moore presents a strategy for entering the mainstream market with an innovative product, but he assumes that that innovation is a technological breakthrough. His ideas center around how to manage technological innovations, and he doesn’t explore innovation outside of technology. In this way, Blue Ocean Strategy departs from Moore’s ideas and appeals to a wider audience.
Two Visual Aids
Kim and Mauborgne have developed several visual tools to help you get a clear picture of your situation, your strengths and weaknesses, and your opportunities and threats. Two primary tools, upon which a blue ocean strategy is built, are a strategy chart, which helps you visualize where your product stands against others, and an action table of possible actions that help you evaluate where to apply your resources. Both of these are examined below.
The Blue Ocean Strategy Chart
Kim and Mauborgne present a graphic tool to help you visualize how your product (and the strategy behind it) differs from others in the market. They call this blue ocean strategy chart a “strategy canvas.” It consists of a two-dimensional line graph:
- The horizontal axis lists the characteristics of competition, that is, the attributes of your product and its alternatives that customers consider when making a buying decision. The authors emphasize that it’s important to list only characteristics that customers actually care about.
- The vertical axis represents the emphasis a company places on each characteristic—a higher score indicates a company offers more of that characteristic.
For each product, service, or company that you wish to compare, plot the value of each characteristic on the graph as a point. Then connect the points to produce a strategy curve.
For example:
The blue ocean strategy chart allows you to see at a glance how similar or how different your product’s offerings are. If your curve has a completely different shape from other curves, this implies a unique combination of value, consistent with blue ocean strategy.
Shortform Commentary: Customer Priorities on the Strategy Chart
Kim and Mauborgne emphasize that you should only include characteristics that your customers actually care about on a blue ocean strategy chart. What they don’t mention is that sometimes, customers care more about certain things than others, even when they take them all into consideration. There are a couple of ways you could enhance your blue ocean strategy chart to reflect the priorities that customers put on different characteristics.
One way would be to sort the characteristics from most important to least important. As you interview customers to figure out what characteristics they care about, ask them which characteristics are more important to them than others. Once you determine how your customers prioritize different product characteristics, put the most important one at the left edge of the chart, followed by the others in order of importance from left to right. If the example chart above had been organized this way, it would show that customers care most about price and second-most about reliability, while training is the least important characteristic that they care about.
Another way would be to scale the height of each characteristic on the chart according to how important it is. In this case, the first step would be to talk to your customers and find out how much they value each of the different characteristics of the product. Then, based on their answers, assign a weight factor to each characteristic. The weight factor is a number that indicates how important that characteristic is. When you plot the value that a particular product provides on your chart, multiply the value by the weight factor for each characteristic. The chart below shows the original product strategy curve, the weight factors, and the resulting weighted strategy curve, to illustrate how multiplying by the weight factors visually exaggerates the characteristics that are more important to customers.
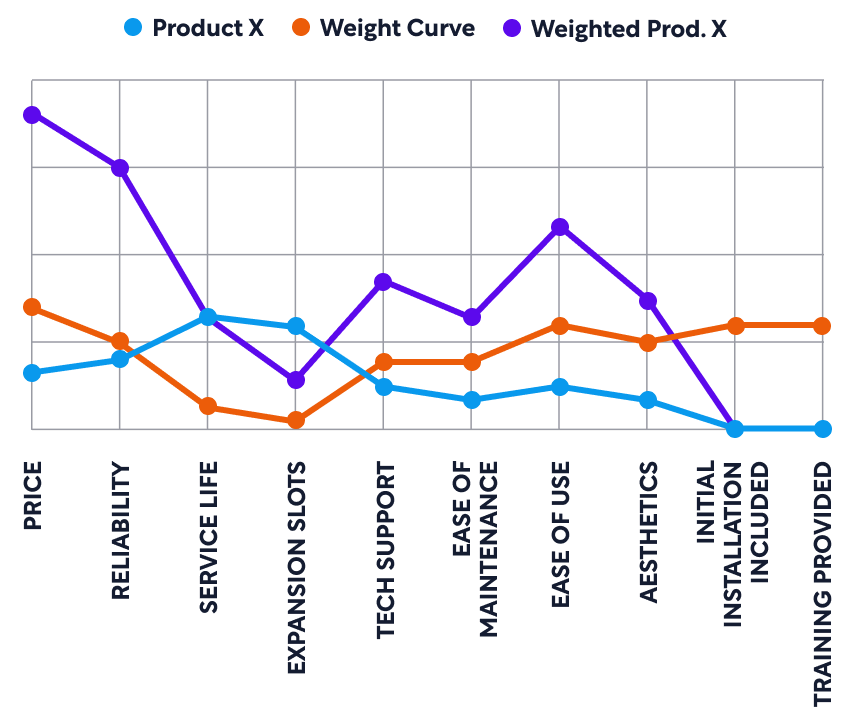
However, for the purpose of exploring your strategy, you would only actually plot the weighted strategy curve for each product that you want to compare. Since you multiply each product by the same weight factors, the curves still allow you to compare different products and strategies, but they would make the customers’ priorities stand out visually.
Revealing Red Oceans
Kim and Mauborgne note that, if the curve of your product closely follows that of another, then the two products follow the same value strategy. Similarly, if your curve is either lower or higher than the other but has the same overall shape, then one product is just a premium or budget version of the other. (In our example above, Product X is a premium version of Product Y.) Kim and Mauborgne warn that in either case, this implies red ocean strategy, with direct competition between the products.
Troubleshooting Red-Ocean Strategy Curves
What should you do if your blue ocean strategy chart indicates your new product is a red ocean concept? According to Al Ries and Jack Trout, sometimes it’s not even necessary to change your product in order to give it unique value. As we noted, Kim and Mauborgne emphasize listing only characteristics that your customers would actually care about, not just trivial characteristics that superficially differentiate your product. However, maybe customers would care about some of those differences if you showed them why they’re important.
For example, perhaps your product is just a little smaller than any of the others on the market, and that makes it easier for smaller people, such as children, to use. Until now, no one cared about this difference because you were competing for adult customers. But if you market your product as the only offering of its kind for children, then suddenly it has unique value and no direct competition. In this case, you’ve created a new characteristic (child friendliness) on the blue ocean strategy chart without changing the product itself at all. (As we’ll discuss in the next section, you’ve also reached out to potential customers—in this case, children.)
The blue ocean strategy chart can also show you how targeted your offering is. According to Kim and Mauborgne, it’s very unlikely that all customers care equally about all the characteristics. Thus, if your strategy curve is nearly flat, it implies that you’re trying to appeal equally to everyone. They warn that in this case, your product will not be as compelling to anyone as a more focused offering would be. In our example above, Product Z is falling into this trap.
(Shortform note: Ries and Trout likewise observe that appealing to a specific audience is crucial for successfully marketing a product, and they add the nuance that maintaining this focus can be psychologically difficult because it’s counterintuitive: To target a specific market sector, you have to give up targeting other sectors, so you’re targeting fewer customers in order to make more sales. This counterintuitiveness makes it easy to make the mistake of trying to be everything to everyone.)
Action Table
The second major visualization tool that Kim and Mauborgne present is an action table divided into four quadrants, representing the four ways you can differentiate your product from other offerings. You can use the table to evaluate the current state of your industry by examining four questions:
- Which characteristics of products in your industry could be decreased without affecting customer satisfaction?
- Which might be completely eliminated?
- Which should be increased in order to increase customer satisfaction?
- What characteristics don’t currently exist but should? What might you create?
The table for the “New Offering” shown on our blue ocean strategy chart example would be:
| Reduce
Service Life Tech Support |
Increase
Ease of Use Aesthetics |
| Eliminate
Expansion Slots |
Create
Initial Installation Included Training Provided |
(Shortform note: We have reorganized Kim and Mauborgne’s original presentation of the four quadrants. Specifically, we’ve swapped the reduce and eliminate quadrants. This change improves the organization of the grid because it creates stronger row relationships: The top row consists of actions that are a matter of degree (reduce or increase) while the bottom row consists of actions that are categorical (eliminate or create). As with the authors’ original arrangement, our table presents the positive actions (increase or create) in the right column, and the negative actions (reduce or eliminate) in the left column.)
According to Kim and Mauborgne, a good blue ocean strategy will typically have characteristics in all four quadrants. If you only have characteristics in one or two quadrants, you’re probably engaging in red ocean competition, rather than differentiating your product enough to create a blue ocean. However, they also point out that a good blue ocean strategy usually focuses on changing a few key characteristics, rather than spreading changes over everything that can be changed.
How to Pick Your Quadrants
The four-actions framework that Kim and Mauborgne present is helpful for concisely expressing your product differentiation strategy, but it doesn’t tell you which characteristics to put in each quadrant. To decide on that, you have to understand what your customers really care about.
How do you find out what they care about? The obvious answer is to ask them, through surveys, focus groups, or their feedback on social media. However, the quality of this data is limited because most customers only discuss problems and solutions they’re currently aware of. They don’t have the vision or expertise to describe an ideal solution that they’ve never seen and tell you to build it for them. For example, imagine a letter carrier interviewing a customer in the early 1800s. The customer might say he wanted faster delivery of his letters, or more frequent pickups and deliveries to reduce turnaround time, but he probably wouldn’t ask for the ability to just pick up a handset and talk directly to the person he was writing to, because the telephone hadn’t been invented yet.
The solution to this problem comes in two steps:
First, instead of taking customer suggestions at face value, analyze them to see what problems the customer is really trying to solve. By understanding your customers’ problems and pain points, you can get a clearer picture of how existing options are underserving or overserving them. In our example, the customer asks for reduced turnaround time on correspondence, but his real problem is that communicating by writing letters is slow, a problem that was solved by real-time communication technologies.
Second, once you think you have a solution to your customers’ problems, put it to the test by showing it to them. This mitigates the limitations of the initial customer surveys because now they can see the new option and compare it to other existing options. This data allows you to validate the choices represented on the four-actions framework, and will also be useful for filling out a customer experience scorecard, which we’ll discuss next.
Part 2.1: How to Brainstorm Ideas to Redefine the Market
In Part 1, we introduced the concept of a blue ocean, as well as the concept of blue ocean innovation (or “value innovation”) and how it creates blue oceans through new ideas that redefine the market. To help you come up with new ideas, Kim and Mauborgne explore some different approaches you can take to brainstorming.
Approach 1: Consider Your Customer’s Alternatives
Kim and Mauborgne advise you to consider what alternatives your customers have for achieving the goal that your product fulfills. Especially consider alternatives that achieve the same end by different means. What are the key characteristics that might lead them to favor each alternative? How could you combine key characteristics from different options to create a new alternative that’s uniquely attractive?
For example, rock-climbing gear and video games are very different products that perform very different functions, but they are often used to fulfill the same basic goal of connecting with friends in a thrilling environment.
Considering Your Market Alternatives
In Crossing the Chasm, Moore approaches this subject from a slightly different angle. Specifically, where Kim and Mauborgne invite you to consider alternatives as a way to brainstorm new innovations, Moore assumes you’ve already got an innovative product, and considers alternatives from the perspective of figuring out where your product fits into the market.
Thus, he advises that you think about what other functions your technology might be used for. For example, maybe you’ve been competing in the electric vehicle market, but then you realize that you could use the same basic technology to make electric farm tractors. If nobody else is currently doing that, your product would provide unique value.
Approach 2: Consider How Customers Weigh Price Against Performance
According to Kim and Mauborgne, there are often groups of companies within an industry that pursue a similar strategy based on a balance of price and performance. For example, luxury car brands like Ferrari and Porsche could be considered one strategic group, while budget car brands would be another.
As with alternative industries above, consider what characteristics motivate your customers to buy from one strategic group over another, and then concentrate on delivering those characteristics while eliminating needless ones.
(Shortform note: In Positioning, marketing consultants Al Ries and Jack Trout assert that product maturity is often a key characteristic in how customers weigh price against performance. They say that if a product or technology is new and unproven, people tend to favor budget versions, because they can try it out without risking as much money on it. However, if the technology is mature, they are more receptive to premium versions. You can apply this to your own blue ocean strategy by considering your product’s maturity and pricing accordingly.)
Approach 3: Consider Different Buyers in the Chain
Kim and Mauborgne point out that when looking for customers, companies often target the person with purchasing power. However, sometimes this is a different person with different preferences than the actual user. Consider targeting the end user’s pain points, or persistent problems, especially if they’ve traditionally been ignored, to create a product with unique value.
Types of Buyers
One of the key elements of Moore’s strategy is to identify a niche market of customers who have a compelling need that your product can meet. Thus, Moore echoes Kim and Mauborgne’s assertion that offering a unique solution to your customers’ pain points is a recipe for success. Moore differentiates between three types of buyers:
The economic buyer is the person who pays for the product or authorizes the purchase.
The technical buyer is the person who sets up the product so it can be used.
The end user, or functional buyer, is the person who uses the product once it’s set up.
For example, suppose your son, who recently got his driver's license, wants to take up off-roading, and he convinces you to buy a protective roll bar for his vehicle. You’re the one who pays for it, so you’re the economic buyer. The mechanic who installs the roll bar is the technical buyer. Your son is the end user, or functional buyer.
Approach 4: Consider Complementary Products
Kim and Mauborgne note that products are rarely used in isolation. Consider what happens before, during, and after your product is used. Is there friction between any of these activities? If so, can you provide a bundled solution that would make things run more smoothly? Bundling complementary products to your product—even at cost—may add additional value.
For example, suppose you sell kitchen appliances, and you discover that your customers tend to juggle a phone or laptop while they’re cooking because they’re referring to recipes online. So you bundle a tablet PC with your appliances and provide a magnetic bracket to mount it conveniently on the refrigerator door.
(Shortform note: The authors’ recommendations for offering complementary products corresponds to another key element of Moore’s strategy: assembling the “whole product.” Like Kim and Mauborgne, Moore points out that your core product offering typically only provides part of the whole solution that the customer needs. For example, if your product is a smartphone, they also need a data plan to make use of it. In cases where it’s not practical to furnish the complete solution yourself, Moore recommends forming alliances with other companies who can provide the other pieces of the puzzle. This ensures that your customer can get the “whole product.”)
Approach 5: Consider Adding Function or Emotion
Kim and Mauborgne observe that most industries tend to gravitate toward either functionality or emotion.
For example, cosmetics tend to lean heavily toward emotion: They are designed and marketed under the assumption that people will buy them because they want to feel beautiful. Meanwhile, house paint leans more toward function: It is designed to provide objective benefits like durability, ease of application, and the ability to precisely match an existing color.
To innovate your product, Kim and Mauborgne recommend that you consider making an emotional product more functional by stripping away emotional trappings, or making a functional product more emotional. So, to continue our examples, what if you took a more objective, “house paint” approach to selling cosmetics by citing how long-lasting a product is? Or what if you created a line of “cosmetic” house paint that (together with your advertising) makes homeowners feel better about themselves and their homes for using it?
(Shortform note: Be careful not to go too far in the direction of functionality—sales expert Oren Klaff argues that to pitch a product successfully to a prospective customer, you must appeal to the primitive, emotional side of the brain first. Otherwise, it will filter out your message, and it will never reach the rational part of the brain. In light of this, making a functional product more emotionally engaging makes sense, but stripping away emotional frills to make a product more functional could be a risky proposition. If taken to the extreme, it might make it difficult to sell.)
Approach 6: Consider the Impact of Trends
Kim and Mauborgne assert that trends can inspire blue oceans, but they caution that blindly projecting current trends and trying to keep up with them is not a blue ocean strategy. Instead, they argue that only trends meeting the following criteria are meaningful:
- The trend must have a decisive impact on your industry. For example, if your business is building airplanes, trends in clothing fashion aren’t likely to affect you.
- The trend must be driven by forces or movements beyond your control (or your competitors’ control), such that it’s irreversible. For example, the trend toward globalization of commerce seems inevitable because it’s driven by human nature and market dynamics beyond any company’s control.
- The trend must have a clear direction. If you can’t tell where the trend is leading, then it’s not useful. For example, trends in clothing fashion rarely follow a predictable trajectory.
Once you’ve identified the relevant trends, the authors advise you to consider what the market will look like if the trend is taken to its logical conclusion. Then assess how you could tailor your product to provide unique value to the new markets the trend creates.
The Key to Projecting Trends
Management consultant David Mattin argues that there is a simple key to understanding trends so that you can use them to your advantage in business: Instead of focusing on how things change over time, learn what doesn’t change. Understanding constants like human nature allows you to predict how new developments will play out.
This principle relates to all three of Kim and Mauborgne’s criteria for useful trends:
First, the experience and expertise you’ve gained in your industry so far is something you can’t go back and change. This is one reason to focus only on trends that impact your line of business.
When a trend is irreversible, it’s usually because the forces driving the trend are based on unchanging principles. If you understand the timeless constants of human nature, you’ll be in a good position to assess whether a trend is reversible or not.
If you understand the constant forces that are driving a trend, you’ll be able to extrapolate it to its logical conclusion. Understanding what won’t change is what allows you to predict what will, making the trend’s direction clear.
Approach 7: Consider the Needs of Potential Customers
As you brainstorm ways to redefine the market, Kim and Mauborgne advise you to reach beyond existing demand and include potential customers in your assessment, as well as actual customers. If you can solve a problem that is preventing people from buying products in your industry, you may create a blue ocean of new demand from both within and outside your industry. For example, drivers in rural areas generally consider electric vehicles out of the question because their typical driving distance is longer than the battery life of the vehicle. If you could produce an electric car that would go 600 miles between charges, you might be able to tap into a rural customer base.
The authors divide potential customers into three tiers:
- Tier 1 potential customers are existing customers in your market who aren’t happy with their current options and are waiting to jump at better alternatives.
- Tier 2 potential customers are people who have considered your industry’s options but have decided not to consume them because the current options don’t meet their needs.
- Tier 3 potential customers are people who have never thought of your industry’s products as an option.
Then they advise you to consider the commonalities between all three tiers to find their unmet pain points.
Expanding Into Adjacent Niches
Expanding your market to include additional customers is also a key element of Moore’s strategy, but he presents it as a phased process:
First, you target a specific niche market of customers with a specific problem and focus on them exclusively until you become the market leader in that niche. (In Moore’s model, establishing market leadership in this niche first is important because it gives you greater credibility with mainstream customers.) Kim and Mauborgne’s Tier 1 potential customers—people hesitant to consume the current product offerings because of pain points that your product eliminates—seem like ideal candidates to target in this phase of Moore’s strategy.
Once you’ve secured a leadership position in your niche, Moore then advises you to pick an adjacent niche to expand into, and focus your efforts there until you dominate that market sector as well. At this stage, you would likely be targeting Tier 2 and Tier 3 potential customers. To win the second tier, you’d need to convince them that your product solves the problems that prevented them from buying prior options. To win the third tier, you’d need to make them aware of your product and the value it offers for their application.
After securing your second niche, you choose another, and so on, until you dominate the entire market for your type of product.
Exercise: Brainstorm New Offering Ideas
To begin brainstorming ideas for a blue ocean offering, think of a product or service your company already sells, to use as a starting point.
What alternatives do customers have to your product? Why do they use them? Could you combine these features into your offering?
What happens before, during, and after your product is used? What are the most difficult or distasteful parts, and how could you make them easier?
What characteristics do your customers consider when they balance price and performance? Can you combine their most important characteristics into a new offering, while eliminating everything else?
Does your industry lean toward the functional or the emotional? If functional, can you inject emotion into your product to grow demand and highlight additional value from your product? If emotional, can you strip away unnecessary extras to make it more functional?
Part 2.2: Formulate Your Strategy With Visual Aids
Now that you’ve brainstormed ideas for creating a blue ocean and you understand the tools at your disposal for exploring blue ocean strategies, let’s discuss the mechanics of developing your high-level strategy. Kim and Mauborgne break this process down into four phases, each of which uses visual tools or strategies to help you properly evaluate your options:
Phase 1: Examine Your Current Situation
Before you can develop a strategy for transforming the market, you need to get a firm, clear understanding of the current state of the industry and how your company fits in. To do so, the authors advise you to draw a blue ocean strategy chart (discussed earlier) showing the current state of your product and the industry, and to fill out an action table to think through how you might formulate a plan to differentiate your product. They recommend appointing separate teams to investigate different opinions on the relevant characteristics of competition.
(Shortform note: This initial blue ocean strategy chart could be applicable to your marketing strategy as well as your product strategy. Al Ries and Jack Trout assert that understanding your current positioning, that is, how people view your product or company, especially in relation to the competition, is the first step toward positioning your product for success. Furthermore, they observe that people outside your company usually don’t view your company or product the way you do, corroborating Kim and Mauborgne’s assertions about overcoming denial. As you uncover the truth, the blue ocean strategy chart that you prepare here should concisely present how your product compares to alternatives in the eyes of your prospective customers, and thus fulfills the first step of market positioning strategy as well.)
Phase 2: See Customer Problems in Person
Kim and Mauborgne say exploring customer problems in person is a crucial step to provide inspiration for new offerings, so that you can see for yourself where your product’s strengths and weaknesses are. They recommend talking to customers, former customers, potential customers, and competitors’ customers, as well as watching people use your product. They also recommend that you personally try out the available alternative products. By visually seeing for yourself how your customers are responding to and using your product, you can identify how current offerings are overserving customers (forcing them to pay for more than they need) as well as how they are underserving them (creating pain points).
Based on your findings, Kim and Mauborgne recommend that you (or your team) draw several new blue ocean strategy charts representing possible new offerings, each with a unique combination of characteristics to increase, decrease, eliminate, or create value.
(Shortform note: Psychological research corroborates Kim and Mauborgne’s recommendation to meet with customers in person. As you explore customers’ problems, nonverbal communication provides you valuable insight into what they’re feeling as they use the product, which helps you identify their values and pain points so you can determine what characteristics to increase, decrease, eliminate, or create. Robert Greene reports that as much as 65% of communication in a conversation is nonverbal, and people tend to present their feelings almost entirely through nonverbal communication.)
Phase 3: Seek Input
Kim and Mauborgne recommend presenting your possible blue ocean strategy charts to management, employees, customers, and potential customers and asking for their input. They recommend doing this in a large, participatory meeting in which all decision-makers can examine and comment on the strategy charts and action tables you’ve developed. Keep track of which strategies your stakeholders favor or oppose, and their reasons—you can even use sticky notes or colored stars to help people visually mark their preferences. End your meeting by synthesizing a final strategy based on the commonalities and strong points of all the possibilities.
Inclusive Versus Exclusive Strategy Meetings
While Kim and Mauborgne emphasize making this strategy meeting very inclusive: It should be open to a broad range of stakeholders, such as employees and potential customers. Others, such as Moore, have advised almost the opposite, limiting the people in strategic decision meetings to the minimum possible number of stakeholders—only those who could veto the decision if they disagreed with it.
Both approaches have their pros and cons. The fewer people you need to get agreement from, the faster you should be able to reach a consensus. In some cases (such as a small start-up trying to get its first product to market so it can become financially self-sustaining), this ability to move faster could be a significant advantage.
However, the more people you include, the broader the consensus will be when you do reach a decision. This might be a more significant advantage. For example, if you have to change the direction of an established company to implement a blue ocean strategy, building a broader consensus might help to build momentum for the change.
Phase 4: Communicate Your Strategy
Kim and Mauborgne recommend distributing copies of your blue ocean strategy chart to your team, showing your “before” and “after” strategy curves on the same page so that people can clearly see the change in direction. They point out that it’s important for your whole organization to understand the change because, going forward, you’ll only support projects that support your new strategy.
(Shortform note: A Harvard Business Review article emphasizes that companies can’t grow if they don’t communicate their strategy and goals to employees. For best results, they recommend keeping your message simple but meaningful, showing how your strategy is driven by insight into the market or customer needs, and remaining visible and accessible to your employees. Kim and Mauborgne’s approach lends itself well to meeting these recommendations, since the blue ocean strategy chart presents meaningful strategy information simply, is derived from analysis of customer needs, and is easy to disseminate, fostering visibility.)
Exercise: Practice Using an Action Table
Recall that Kim and Mauborgne’s action table consists of four boxes in which you record which characteristics of a product you would decrease, increase, eliminate, or create. In this exercise, you’ll create an action table for the blue ocean offering that you brainstormed in the last exercise, after Part 2.1.
What characteristics does your industry take for granted that could be eliminated? What would your customer not miss if it were gone?
What characteristics could be reduced? In what ways is your customer overserved by existing offerings?
What characteristics could be improved? In what ways is your customer underserved by existing offerings?
What characteristics might be created that your industry doesn't currently offer? What does your customer need in your offering that doesn’t currently exist in alternatives?
Part 2.3: How to Develop Your Business Model
By now you’ve brainstormed and vetted possible blue ocean strategies and you’re ready to get down to the nuts and bolts of what you’ll offer. Because your ultimate goal is a profitable business, Kim and Mauborgne propose developing your business plan in a strategic sequence:
- Be sure that your product delivers exceptional value to your target buyers.
- Set a price that will attract your target buyers.
- Figure out how you can reduce your costs to leave you with a desired profit based on your strategic pricing.
The authors emphasize that these are sequential steps—you move to the next step only after it’s clear the current step is a success. Furthermore, no later step should strongly influence an earlier step.
For example, suppose you come up with an idea for a product that offers unique value, and you determine that your optimal retail price is $100. However, you assess your costs and find that it will cost $150 to produce each item. Kim and Mauborgne don’t recommend that you solve this problem by going back and adjusting the first step of the process (creating a product that offers value), as doing so will leave you with an inferior product that doesn’t stand out in the market. Nor do they recommend that you adjust the second step (setting a strategic price), as this will make you less competitive. Instead, they advise that you focus on reducing costs, and if you can’t reduce costs enough to make your idea profitable, they advise that you simply start over with a new idea, as this one won’t work.
Comparing Business Models: Blue Ocean Strategy vs. Crossing the Chasm
Moore’s business model from Crossing the Chasm includes some similar steps, but also some additional steps that may be useful when you’re introducing a new product. Unlike Kim and Mauborgne, who assume you are already active in a certain market and teach you how to come up with a strategic product offering, Moore assumes you already have an innovative, high-tech product, and teaches you how to enter the market. His business model has four steps:
Select a niche market for your product. This is functionally the same as Kim and Mauborgne’s first step: If you’ve already developed a breakthrough product, the way you make sure it delivers exceptional value to your target buyers is to target the right buyers. Figure out who can get the most unique benefit from your product, and choose them as your niche market.
Make the whole product available. In some cases, your product is only part of the whole solution that your customers are after when they buy it. For example, if you buy a microwave oven, you also need electricity in order to use it. Kim and Mauborgne don’t really address this step, and it’s not applicable to every product. However, if you introduce a product that requires other products or services, you’ll need to make sure your customers can get what they need to make your product work. For example, to sell hydrogen-powered cars, you’d need to make sure your customers would have access to hydrogen fuel, whether you sell the fuel yourself, or arrange for another company to sell it.
Position your product. “Positioning” is a marketing term for how potential customers see your product in relation to other alternatives. In blue ocean strategy, you’ve already laid the groundwork for positioning by comparing your product to alternatives on the strategy chart. You just need to make sure your marketing campaign communicates your product’s unique value effectively to your target customers.
Select your distribution channel and set your price. This correlates to Kim and Mauborgne’s first and second steps since you’ll evaluate the best way to have your product delivered as you evaluate your customer’s experience to make sure your product provides unique value.
Step 1: Evaluating Your Customer’s Experience
Kim and Mauborgne assert that you should never assume customers will regard something as an improvement just because it’s a novel idea. Generally, customers don’t really care about the product’s originality or underlying technology. They care about whether the product solves their problems better than other alternatives.
(Shortform note: The Technology Adoption Life Cycle, or TALC, substantiates this principle numerically. Specifically, the TALC divides the total market for any new innovation into five categories of buyers. The “innovators'' value technology for its own sake, but they are the smallest group, making up only about 2% of the total population. The other 98% don’t care how novel your product is if it doesn’t improve their lives.)
The Customer Experience Scorecard
So, does your idea really provide superior customer value? You’ve already prepared a blue ocean strategy chart illustrating the unique value that your offering provides, but now it’s time to dig deeper into the value it provides at every stage of the product life cycle. To do so, Kim and Mauborgne advise that you use what they call a “buyer utility map,” which is essentially a customer experience scorecard analyzing how your customer responds to your product in every stage.
The customer experience scorecard is a six-by-six table. The columns are labeled according to the six stages of the product life cycle: purchase, delivery, use, augmentation (expanding the product’s capabilities through accessories or upgrades), maintenance, and end of life.
(Shortform note: Depending on the product, the buyer experience cycle could be different from the six steps that Kim and Mauborgne present. In some cases, there could be an installation or assembly step in between delivery and use. In other cases, such as when the product is a one-time service, steps like maintenance and augmentation might not be relevant.)
The rows are labeled with characteristics rating the quality of the customer’s experience in six categories: efficiency, simplicity, convenience, risk, glamour, and environmental friendliness. As you consider each of these characteristics during each of the product’s life cycle stages, the authors invite you to ask yourself where the buyer would encounter problems or pain points. For example, how simple is it for them to purchase your item? How convenient is it to get it delivered? Are there disposal issues that create a problem for environmental friendliness at the end of life?
The boxes on the scorecard give you a tool to think through these questions systematically and record your answers. Kim and Mauborgne advise that your product should clearly create more benefit than the alternatives in at least one of the 36 spaces on the map, and the benefit it creates should be in different spaces than the competition.
A blank example of a customer experience scorecard is shown below.
| Customer Experience Scorecard | ||||||
| Purchase | Delivery | Use | Augmentation | Maintenance | End of Life | |
| Efficiency | ||||||
| Simplicity | ||||||
| Convenience | ||||||
| Risk | ||||||
| Glamour | ||||||
| Environmental Friendliness | ||||||
Different Ways to Use the Customer Experience Scorecard
After you assess the customer experience in each box, Kim and Mauborgne are a little vague as to how you actually record your results on the map. Thus, different people have used the customer experience scorecard in different ways:
Some simply place an X in each box where there is a significant pain point with the product under consideration. Others use these pain points to identify areas of opportunity for creating blue oceans, and mark each of these boxes with a blue circle, while marking boxes the industry is currently focusing on with red circles.
Still others start by placing a circle or box of one color in each space where existing products offer significant buyer utility. Then they use circles or boxes of a different color to mark each space where your new product would offer significant utility. Finally, if there are any spaces where both products offer utility, they use plus or minus signs to denote whether your new product would offer more or less value than the alternative.
Some combine the above methods, using colored squares or circles to denote significant value for different products, and X’s to denote pain points.
Some use it to assess the buyer utility of a product idea quantitatively by assigning a numerical score in each space.
Finally, instead of using the customer experience scorecard directly, you could take the categories from the scorecard and use them to refine your blue ocean strategy chart. Recall that the strategy chart should show all the major characteristics that your customers actually care about. Anything that affects your customers’ experience is probably something they will care about, so ask yourself if efficiency, simplicity, convenience, risk, glamour, and environmental friendliness are adequately captured in the characteristics on your strategy chart. If any of them aren’t, add them to your strategy chart to ensure that the chart presents an accurate picture of value to the customer. This will also allow you to assess how your product stacks up against your competition in these areas.
Step 2: Set Your Price
Now that you’ve figured out an offering that offers superior utility to the customer, you need to figure out how to price it. Kim and Mauborgne advise setting your price to maximize the number of buyers in your market. In other words, you want to select a price that will make your product attractive to as many potential customers as possible.
Comparing Pricing Strategies
In Crossing the Chasm, Moore identifies a number of methods you can use to set your prices.
Customer-oriented pricing is when you set your prices to match your target customers’ expectations, based either on how much tangible value your product provides to the customer (value-based pricing) or how your product compares to alternatives (competition-based pricing). Clearly, Kim and Mauborgne are advocating customer-oriented, competition-based pricing.
Vendor-oriented pricing is when you set your prices based on your own costs and business needs. Both Moore and Kim and Mauborgne advise against using vendor-oriented pricing.
Distributor-oriented pricing is when you set your price to motivate your distributors by making your product the most profitable one for them to sell. Moore advocates using distributor-oriented pricing because it makes it easier to sell your product through established, reputable distributors, who can give a new product credibility in the mainstream market.
Advantages of Pricing to Maximize the Number of Customers
The authors say that appealing to as many buyers as possible up front has several advantages over the common practice of starting with a premium price to attract early adopters and then gradually lowering prices to attract mainstream customers:
1. Often, appealing to the maximum number of buyers maximizes profits, because in many industries, fixed costs (one-time expenses associated with launching your product) are high and marginal costs (ongoing expenses associated with delivering each unit that you sell) are low, so attracting more buyers will subsidize your fixed costs while not costing you much more per customer. This is particularly true in software and R&D-heavy industries.
2. Many products benefit from network effects, where the value of the service scales with the number of users.
(Shortform note: Reid Hoffman and Chris Yeh devote most of their book Blitzscaling to these two points. They explain how the internet has driven marginal costs to near zero in many cases, and discuss the “first-scaler advantage” created by network effects. They point out that by growing quickly from the outset, you can reduce the risk of a competitor gaining this advantage before you do. This reinforces Kim and Mauborgne’s strategy of pricing for the masses up front.)
3. Strategic prices help earn a reputation for your brand immediately, making it harder for others to copy your strategy and turn your blue ocean into a red one.
(Shortform note: According to Ries and Trout, market leadership is self-perpetuating in this way. They assert that it is almost impossible to displace a market leader, once people view them as such, because brand loyalty drives greater demand and their reputation makes it easier for them to raise capital for expansion and attract the best talent to their workforce.)
How do you actually set your price? Kim and Mauborgne prescribe a two-step procedure: First, you establish a price range by researching pricing for major alternatives. Then you select a price within that range based on how difficult it is for others to imitate your offering. Let’s consider each of these steps in more detail:
Determine the Right Price Range
Kim and Mauborgne advise that you start by cataloging the alternatives to your product so you can establish the range of prices that customers might expect to pay for a product like yours. They note that some alternatives may look different but serve the same function— for example, cooking your own food can serve the same function as eating at a restaurant. They also note that some alternatives may serve completely different functions but still achieve the same objective—for example, rock-climbing gear and video games serve very different functions, but they can fulfill the same objective of connecting with friends in a thrilling environment.
(Shortform note: When considering pricing, it may be worth considering product alternatives as well, because your customers may consider them. Moore defines product alternatives as products with different purposes that are based on the same technology. For example, an electric egg beater and an electric drill are used for completely different things, but they are made up of essentially the same components: an electric motor, a power supply, a gearbox, a coupling mechanism to hold the drill bits or beaters, and so forth. Consequently, it makes sense that they should cost about the same.)
The authors advise that higher prices may increase the amount of profit per customer, but not necessarily enough to increase overall profit, if you make fewer sales. To help you zero in on the range of prices that will give you the highest total revenue, Kim and Mauborgne present a graphic tool they call the “price corridor map.” It’s a graph with price on the vertical axis and a measure of how similar or different the product is to yours on the horizontal axis. The more different a company is from yours, the further to the right it should lie on the horizontal axis.
Plot each alternative as a circle on the graph. Different alternatives will likely have different numbers of customers, so draw larger circles to represent alternatives with more customers and smaller circles for products with fewer customers.
According to Kim and Mauborgne, you can then use the distribution of circles on the graph to identify a horizontal band representing the range of prices which you would expect to earn the most total revenue.
Here’s an example:
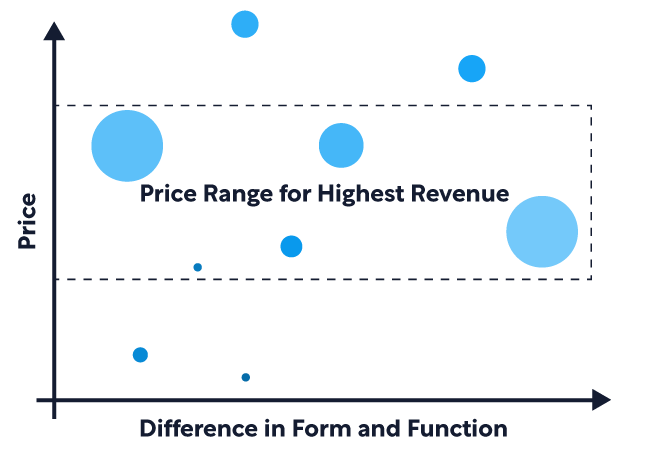
Shortform Commentary: Another Way of Visualizing Your Optimal Price Range
Kim and Mauborgne’s graph shows expected revenue only indirectly: The size of the circles correlates to the number of buyers, while the position of each circle shows the price, so to get the total revenue of any alternative, you would multiply the price by the number of customers.
To identify the range of prices that maximize revenue, a different kind of graph might be more suitable. Specifically, for each alternative, you could first multiply the price by the number of customers who buy that particular alternative to calculate the total revenue. Then, you could plot the revenue on the y-axis against price on the x-axis, and fit a bell curve or polynomial approximation to the data. The curve shows you the relationship between revenue and price, which is what you need to know to select the price range that will yield the most revenue.
For example, suppose you have the following list of alternative products:
| Offering | Unit Price | User Base | Revenue |
| Alternative A | $10.00 |
1000000 |
$10000000 |
| Alternative B | $20.00 |
200000 |
$4000000 |
| Alternative C | $25.00 |
1000000 |
$25000000 |
| Alternative D | $25.00 |
25000 |
$625000 |
| Alternative E | $30.00 |
100000 |
$3000000 |
| Alternative F | $35.00 |
500000 |
$17500000 |
| Alternative G | $40.00 |
400000 |
$16000000 |
| Alternative H | $45.00 |
14000 |
$630000 |
| Alternative I | $55.00 |
5000 |
$275000 |
| Alternative J | $65.00 |
5000 |
$325000 |
| Alternative K | $75.00 |
10000 |
$750000 |
Your graph would look like this:
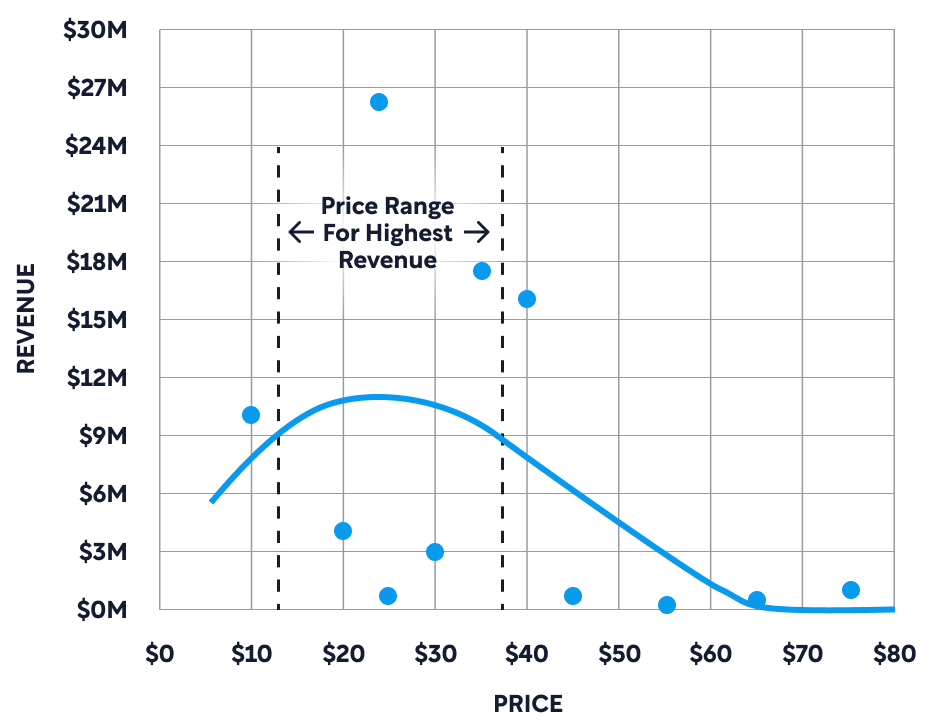
This graph allows you to see the expected revenue at a given price point directly. However, the one thing it doesn’t show you that Kim and Mauborgne’s original graph does is how similar each alternative is to your product. Admittedly, buyers are more likely to compare your product with alternatives that are more similar to it. But product similarity is sometimes difficult to quantify. Thus, Kim and Mauborgne’s “price corridor map” may offer advantages for intuitive assessment of your ideal price range, while this graph facilitates a numerical assessment of what price range will generate the most revenue.
Specify a Price Level Within Your Price Range
Now that you have a price range, Kim and Mauborgne advise setting your price based on two factors:
- The defensibility of your product
- The relative benefits of scale
According to Kim and Mauborgne, the defensibility of your offering depends on:
- Legal protection through patents, copyrights, or other intellectual property
- Exclusive assets or capabilities that make your offering difficult to imitate
(Shortform note: Author Thomas L. Friedman argues that patents have become less relevant today, because many new inventions become obsolete faster than you can get a patent on them. It typically takes four to five years for the patent office to process and grant a patent. This shifts the emphasis of defensibility more toward capabilities that are difficult to replicate.)
According to Kim and Mauborgne, the benefits of scale depend on:
- The significance of network effects (how much your offering becomes more attractive as your user base grows)
- The ratio of fixed costs to marginal costs
(Shortform note: As Hoffman and Yeh explain, there can also be corresponding costs that limit your scale. First there is the human limitation: Maybe your product becomes more beneficial as more people adopt it, but if it also requires more personnel to support it as the user base grows, this benefit comes at a cost. Hoffman and Yeh point out that the complexity of managing a team grows exponentially with the size of the team, so the fewer employees it takes to support a given number of customers, the lower the costs of scaling up. Second, are the limitations of your infrastructure. This influences your ratio of fixed to marginal costs, because the more you spend on production infrastructure up front, the more you can drive down the marginal cost of production, but at the outset you have a finite budget for infrastructure.)
Kim and Mauborgne argue that the more defensible your product is, the higher you can set your price, but the greater the benefits of scale, the lower you’ll want to set the price, to accelerate mass adoption.
(Shortform note: Arguably, scale is part of defensibility, because of the first-scaler advantage. If your product has significant network effects, then having a large user base increases its value relative to alternatives with fewer users, making it harder for them to compete with you. Even without network effects, the larger your operation, the more expensive it is to replicate.)
Step 3: Account for Costs
Once you have your strategic price, Kim and Mauborgne advise you to calculate your target cost by deciding what profit margin you want and applying it to your chosen price. They argue that you must not let costs dictate prices, nor should you lower your product’s benefits to match its costs. Doing either will jeopardize mass adoption. Instead, they advise that you aggressively manage your costs to meet your target price. In doing so, you’ll create a product that is more profitable and more difficult to imitate. If you cannot meet your strategic price and maintain an adequate profit margin, they say your idea won’t work and you need to go back to the drawing board.
(Shortform note: Kim and Mauborgne’s directive to figure out your target price first and then manage your costs to achieve it could be considered a business application of Stephen Covey’s directive to begin with your goal in mind. Beginning with a clear understanding of the desired end-state (or in this case the retail price) allows you to chart a course to it and assess its feasibility more definitively.)
As we discussed earlier, blue ocean innovation generally involves reducing or eliminating features that your customers don’t care much about (while adding a unique blend of features that they value). This culling of features up front helps you keep costs down.
Additionally, the authors recommend three more sub-strategies that will help you maintain a profit margin at your strategic price:
Reduce operational costs. There may be new manufacturing processes or materials that offer a cost advantage over traditional ones. Similarly, there may be more cost effective ways of providing services.
- (Shortform note: Some companies are turning to artificial intelligence (AI) to streamline their business operations and thus save costs. AI can perform many payroll and invoicing functions, as well as helping to manage customer relations, and can cut down the need to employ costly workers to do somewhat routine jobs.)
Offload production and distribution activities to capable partners. Kim and Mauborgne say this effectively lowers fixed costs and increases marginal costs. They also point out that it spurs competition among companies trying to win your contract, which drives down prices.
- (Shortform note: Moore also advises partnering with companies who can take on some of your operations, but he cautions against partnering with multiple companies that would be in direct competition with each other, arguing that they’ll be more willing to work with you if you work with them exclusively. In other words, once you select a partner, trying to cut costs further by then partnering with one of their rivals on a different task can backfire.)
Change your pricing structure, such as going from paid to freemium, or from whole-purchase to partial shares or subscriptions. If a customer only buys a portion of the product up front, instead of the whole thing, you can distribute the cost of the product across multiple sales. This allows you to meet your strategic price for each sale, even when you couldn’t sell your product, as a complete unit, for that price and still make a profit.
- (Shortform note: Obviously, even if you defer or distribute your costs over multiple sales, you still need to make a profit in the end. However, the lifetime revenue per customer may be less obvious with these pricing models than with a one-time sale of a complete product up front. Patrick Campbell cautions that many software-as-a-service companies fail because their lifetime revenue per customer is too low in relation to the cost of acquiring each customer, and advises that your revenue per customer needs to be at least three times the cost of acquiring each customer for a subscription service to be viable.)
Part 2.4: How to Plan for the Long Term
Kim and Mauborgne caution that when you create a profitable blue ocean, imitators will inevitably arrive, eventually turning it into a red ocean. There are two ways you can respond:
- Prolong your blue ocean.
- Find a new blue ocean.
In this chapter, we will consider each of these questions in turn.
1. Prolong Your Blue Ocean
To prolong the benefits of your blue ocean, Kim and Mauborgne advise you to pursue a two-fold strategy:
- Maximize the defensive barriers that make your offering difficult to imitate, and thus prevent others from competing with you directly.
- Expand your blue ocean with ongoing innovation.
Let’s explore each of these strategic elements in more detail:
Establish Defensive Barriers
The authors identify a number of barriers that prevent companies from successfully imitating another company’s blue ocean strategy. You can leverage them to keep potential competitors out.
Legal barriers: Patents, permits, and other regulatory hurdles slow down competitors or exclude them entirely.
- (Shortform note: To make use of this barrier, you would secure as many legal protections as possible. Depending on the nature of your product, you may have several options. Utility patents protect functional innovations, design patents protect unique styling or appearance, copyrights protect original literary or artistic content, and trademarks protect brand insignia.)
Cognitive barriers: Because blue-ocean offerings are typically so different from existing industry standards, people often ridicule them rather than try to imitate them.
- (Shortform note: You can maximize this barrier by letting your would-be competitors think they’re smarter than you. In The 48 Laws of Power, Greene advocates this as a strategy for gaining power over others: They won’t catch on to your strategies as quickly if they underestimate you. Obviously, you can’t play dumb in public, because you need to communicate the value of your product clearly to your customers. However, if you can find subtle ways to stroke your competitors’ ego, that might extend the cognitive barrier.)
Organization barriers: Sometimes, even when your rivals start paying attention because your strategy is getting traction, their organizational structure is not set up to imitate your operations. Replicating your blue ocean strategy might compete with their company’s core business (for example, it might entail retraining staff or redesigning a distribution channel), and organizational resistance and internal politics can delay competitive reactions for years.
- (Shortform note: Since you don’t have control over your competitors’ organizations, you would maximize this barrier by selecting unique characteristics for your offering. The more difficult it would be for the makers of alternative products to pivot and emulate your offering, the larger this barrier is.)
Image barriers: If your blue ocean brand image is significantly different from incumbents’, those incumbents might hesitate before replicating your marketing—for instance, luxury players might not want to suddenly offer economical alternatives.
- (Shortform note: You can maximize the image barrier through advertising that positions your product relative to existing alternatives. By reinforcing the alternative brands’ image, and presenting your product as a unique alternative, you make it harder for them to change their image.)
Momentum barriers: Kim and Mauborgne assert that if the strategic price is set at a level that attracts a mass group of buyers, the blue ocean entrant can rapidly develop a large, loyal customer base that is difficult for incumbents to recruit. If this customer base represents a large fraction of the market, it becomes difficult for a competitor to subsist on the remainder. This effect is amplified by economies of scale and network effects.
- (Shortform note: According to Ries and Trout, the best marketing strategy for a brand leader is to emphasize in your advertising that your product is the original, genuine article. This reinforces your image as the brand leader and subtly insinuates that competing alternatives are somehow fakes.)
Expand Your Blue Ocean
Kim and Mauborgne assert that as others begin to imitate your product, it’s important to expand your blue ocean while it is still profitable. They observe that if you’re continually making innovative improvements, you’ll be harder to imitate, because it’s harder to hit a moving target. They suggest rolling out additional features that further enhance and differentiate your product, or encouraging customers and third-party developers to create add-ons that expand your product’s capabilities.
(Shortform note: As you make improvements or offer additional features, be careful not to dilute your brand. In particular, Ries and Trout warn against line extensions (rolling out additional products under the same brand or product line). They observe that the more diverse your product line is, the more vague your brand’s meaning becomes, because a brand has to stand for the entire scope of products and features that your market under it.)
2. Find a New Blue Ocean
However, Kim and Mauborgne also warn that there comes a point where it’s difficult to expand further on a unique product characteristic. When your blue ocean turns red, you may need to look for other blue oceans to enter. They advise you to do this in parallel with extending your current blue oceans, so that when an older strategy reaches the end of its lifetime, your company has new opportunities for growth already lined up.
(Shortform note: There is potentially a significant distinction between opportunities for growth and opportunities for profit. If you are established as the brand leader in the market that your blue ocean strategy created, you may continue to profit from that product line after it becomes a red ocean. As long as the market is not disrupted by innovation that makes your product obsolete, market leaders tend to remain leaders. In fact, in The 22 Immutable Laws of Marketing, Ries and Trout point out that almost every red ocean eventually becomes a “two-rung ladder,” where the market leader has the majority of the market share, the alternative brand picks up most of the remainder, and any other competitors hold only a negligible portion of the market.)
Visualizing Your Long-Term Strategy
Kim and Mauborgne present a graphic tool for visualizing your organization’s long-term strategy by ranking your projects according to their level of innovation and plotting them on a timeline, with time progressing on the horizontal axis and the level of innovation represented on the vertical axis.
When you plot your current projects this way, the distribution of points gives you an idea of where your company is headed in terms of innovation.
(Shortform note: Adding a trend-line to the graph could help to highlight your innovation trajectory even more clearly.)
Here’s an example:
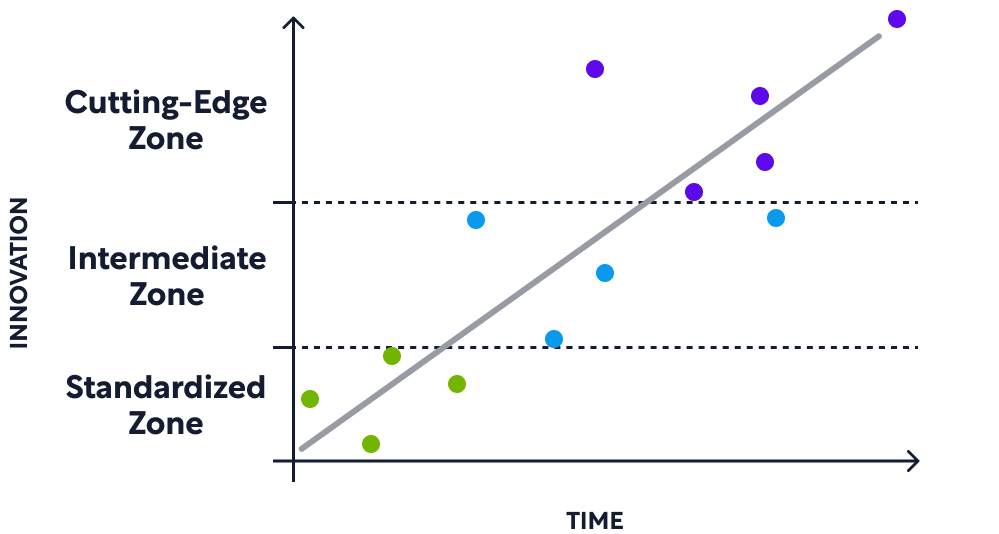
The authors divide the innovation spectrum into three areas:
- The standardized zone is for products and business ventures that copy existing products and compete in a red ocean. Standardized products may yield significant sales revenue at present, but offer little to no opportunity for growth.
- The intermediate zone is for products that improve upon existing products incrementally. They offer limited potential for growth.
- The cutting-edge zone is for blue ocean products. As blue ocean offerings, they offer the greatest opportunity for growth.
Analyzing Your Long-Term Trajectory
Kim and Mauborgne assert that If you practice blue ocean strategy, the trajectory of your organization will shift toward a greater concentration in cutting-edge and intermediate projects over time, as shown in our example graph. They argue that this shift toward more innovative projects leads to new growth. However, they concede that while standardized-zone projects offer little potential for future growth, they may still act as profit centers at present. Thus, ideally, you’ll have a variety of projects spanning the whole range of innovation in your portfolio.
(Shortform note: This concession seems a bit surprising, considering the authors’ earlier assertion that blue ocean startups were significantly more profitable than red ocean startups on average (14% of companies generated 61% of profits). However, it corroborates Ries and Trout’s observation that a leading product may generate profits indefinitely because market leadership tends to be self-perpetuating. Furthermore, given the higher risk involved in more innovative projects, maintaining a balanced portfolio of projects is inarguably prudent, and the authors’ concession illustrates that they remain open-minded even as they present the advantages of blue ocean strategy.)
Shortform Commentary: Graphing the Decay of Innovation
As we just discussed, Kim and Mauborgne plot projects as points or circles on a graph of innovation against time to visualize your company’s long-term trajectory.
However, the innovativeness of a given project or product decays over time: Building incandescent light bulbs was innovative in Edison’s day, but not today. As we discussed earlier in this chapter, every blue ocean eventually turns red as other companies begin to copy your product or strategy.
Thus, rather than graphing projects as points, it might be more accurate to plot them as downward-sloping lines to reflect how the innovativeness of each project declines over time. Then the graph for a company pursuing blue ocean strategy would look something like this:
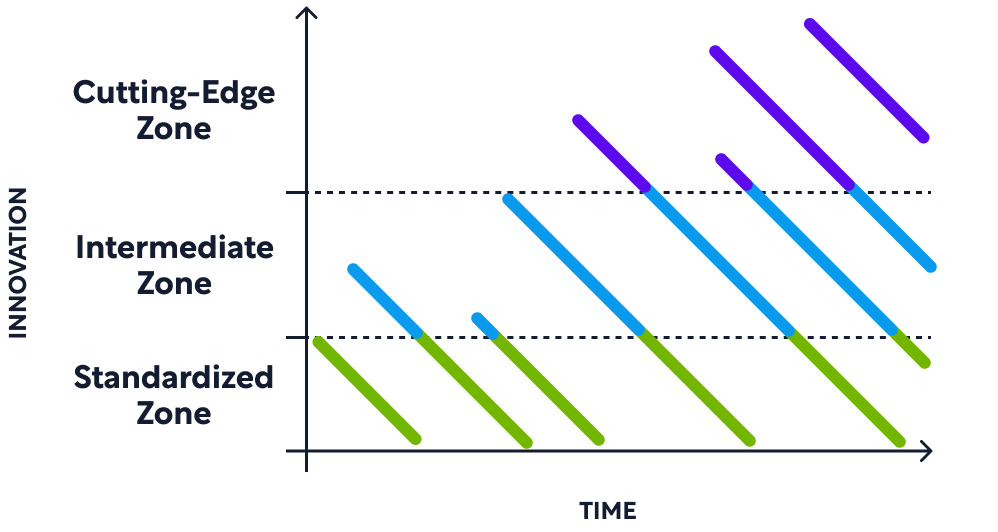
This innovation decay plot can help you estimate when you will need to start new blue ocean projects to maintain your blue ocean strategy. Admittedly, to get accurate predictions, you will need to plot the slope of each line correctly, and estimating how fast each project will slide from the cutting-edge zone down into the standardized zone may not be easy. But historical precedents should give you some idea of how long it takes a novel idea in a given industry to become standardized.
Exercise: Identify Your Defensive Barriers
Recall the five defensive barriers that protect your blue ocean from immediate competition: the legal barrier, the cognitive barrier, the organizational barrier, the image barrier, and the momentum barrier. Now think of the blue ocean offering you brainstormed in previous exercises, or think of another blue ocean offering that you are considering.
What aspects of your product could be protected by patent or copyright?
How does your offering differ from industry standards or common alternatives? How intuitive are its advantages? How fast are your competitors likely to see your product’s potential?
How much would your competitors have to change their operations and brand image to emulate your offering?
How much does your product benefit from network effects and economies of scale?
Given your answers to the above questions, which of the defensive barriers do you think will be the most significant for protecting your blue ocean?
Part 3: Get Your Organization On Board
Now that you have a strategy, it’s time to execute it. In Part 3, we’ll discuss Kim and Mauborgne’s advice on executing blue ocean strategy within your organization, dealing with common hurdles, and achieving alignment with partner companies.
Engage Your Team
Kim and Mauborgne advise that you should keep your team informed of your blue ocean strategy as you develop it, because you need your team to mobilize your strategy. They emphasize that you need to communicate clearly, because everyone on the team needs to understand the strategy in order to do their part effectively.
The authors further advise that you need to communicate more with those who are less involved in the strategic decision making, to circumvent anxiety and distrust that could undermine execution of your strategy. They point out that when strategic decisions are made behind closed doors, and everybody knows something big is coming but nobody knows what it is, they tend to get scared. They may become anxious about job security, or the stability of their position within the organization. The authors warn that this anxiety can foster distrust and skepticism, which in turn fosters poor cooperation when your new strategy is unveiled. They say that if the distrust runs deep enough, employees may even band together to sabotage your strategy, in hopes that its failure will usher in a return to the old status quo that they were comfortable with.
(Shortform note: In Give and Take, Adam Grant argues that trust depends heavily on generosity, and thus generosity enhances networking, which is, in large part, a process of building trust between people. He advises that to cultivate a generous personality, you should start by giving others the benefit of the doubt. Most of them will reciprocate, building mutual trust. Similarly, he says you can cultivate generosity through powerless communication: You can make yourself more approachable by asking questions, seeking advice, and signaling vulnerability.)
Stick to Fair Process
Kim and Mauborgne assert that not only do you need to communicate your strategy, but you need to do it in an equitable manner, because people care as much about the fairness of the process as they do about the ultimate outcome. If they feel listened to and respected, they’ll more likely go along with a decision, even if they personally disagree with it.
(Shortform note: In Never Split the Difference, Chris Ross and Tahl Raz observe that people will often go out of their way to oppose anything they see as unfair, even if it means making irrational choices. This is what you are trying to avoid: If people perceive your blue ocean strategy as an unfair change in the direction of the company, they may reject it in spite of its merits.)
The authors identify three elements of fair process:
- Involve people by asking for their input early in the process and inviting them to discuss other ideas.
- Explain the reasons behind your decisions when you make them, addressing how you considered the input that people gave you.
- Be clear about what people should expect in terms of job security, changes to roles and responsibilities, and how employees will be evaluated in their respective roles under the new strategy.
Workplace Fairness Criteria
Gwen Moran of Fast Company identifies six defining characteristics of a fair workplace:
Rules for promotion, compensation, performance review, and disciplinary action are clear and are applied uniformly.
Similar cases are given equivalent treatment, but each case is considered individually. For example, an employee with a legitimate disability may not be held to the same standards as a healthy employee.)
All employees are given an equal chance to be heard.
Employees are given credit for their ideas.
Managers or senior employees are available to mentor new employees on the rules.
Employees feel like the company cares about their well-being.
Kim and Mauborgne’s directive to involve people in the process and ask for their input correlates to Moran’s principle that all employees have a voice. Letting them discuss each other's ideas also relates to Moran’s principle of giving people credit for their ideas. And getting their input helps to show the company cares about them, consistent with Moran’s final principle.
Kim and Mauborgne’s directive to explain your reasoning fits into Moran’s principle that senior personnel should be available to help new hires understand how the company operates, or in this case, to help everyone understand the company’s new strategy.
Kim and Mauborgne's directive to be clear about what to expect is functionally identical to Moran’s first rule, namely that rules are clear and applied uniformly.
Overcome Organizational Hurdles
As you engage your team in first developing and then implementing your blue ocean strategy, Kim and Mauborgne say you’ll likely face four hurdles, which we’ll explore in the remainder of this chapter.
1. Recognition Shortfall
Kim and Mauborgne observe that stakeholders are often skeptical of the need for strategic change. Thus, to make strategic changes, you first need to convince them of the gravity of the problem. To do this, the authors recommend showing them the problem firsthand, rather than relying on impersonal numbers and metrics. Arrange for them to meet dissatisfied customers in person, or to get their hands on the product and wrestle with its shortcomings personally.
(Shortform note: Before you can make the problem personal for your stakeholders, you must become personally acquainted with it yourself. In To Sell is Human, Daniel Pink argues that one of the keys to success in selling is to see yourself as serving your customers: You serve them by selling them something that will make their lives better. In this case, you’re “selling” your stakeholders a strategy to solve their problem of business stagnation.)
2. Capital Shortfall
Kim and Mauborgne point out that even if your team agrees with the need to change, your company might be restricted by a resource shortfall—money, time, or trained staff to make changes happen. This makes it hard to devote resources to new innovations, especially if managers are competing with each other for whatever resources they can get. To alleviate the problem, the authors advise you to consider where your resources are earning the highest and lowest value per dollar spent, so that you can maximize your returns by shifting resources around.
For example, maybe your company produces instructional videos on a variety of topics. It takes you an average of six hours to produce a cooking video, eight to produce an automotive repair video, and twenty to produce a home improvement video, but each video earns about the same returns. Thus, to increase profits and free up manpower for new initiatives, you cut out home improvement videos entirely and shift your focus heavily toward cooking videos.
(Shortform note: In The 48 Laws of Power, Robert Greene echoes this principle and generalizes it, saying that the key to moving forward is focusing on what will generate the greatest benefit. He applies this not only to physical resources but also to relationships and alliances. In addressing the “resource hurdle,” we’re talking mostly about freeing up internal resources to begin progress on your blue ocean strategy, but as we move on to the political hurdle and aligning external partners later in this chapter, remember that this principle of focusing your resources where they’ll generate the highest returns applies to alliances as well.)
The authors also recommend “horse trading” resources (such as office space, manpower, or equipment) between teams to allocate them more efficiently. Ask your teams about their needs, and shift resources around so that everybody wins. This works because when departments are competing for whatever they can get, it usually results in inefficient allocation of resources between them.
(Shortform note: Also consider repurposing resources to get the most out of them as well. Building on the horse trading analogy, famous old-time horse trader Ben Green once mistakenly purchased a large number of mules that turned out to be too small for the farm work he meant to sell them for. However, he ended up turning a significant profit from them when he found a mine owner who specifically needed mules that would fit in confined spaces to pull ore carts. By the same token, if resources are distributed inefficiently, you may also have machinery that’s being used, but not for the most beneficial application.)
3. Initiative Shortfall
Even after you’ve convinced people of the need to change, and aligned resources with your vision, summoning the motivation to make the change can be a hurdle in itself. According to Kim and Mauborgne, the way to build motivation is to focus your attention on the key influencers in your organization. If you can get them moving, they’ll get the rest of the organization moving. Once you’ve identified your influencers, the authors advise making their actions highly visible. This maximizes their impact and also holds them accountable to each other, preventing pockets of demotivation from forming.
(Shortform note: In Perennial Seller, Ryan Holiday says the key to effectively influencing the influencers in your industry is to see things from their perspective. Influencers are typically people who have earned a reputation for recommending things that are genuinely valuable. They want to maintain that reputation. Thus, if you can show them how your strategy is beneficial to them and the people that look up to them, they’ll become advocates for the changes you propose.)
Kim and Mauborgne also point out that a massive strategic vision can be daunting, and advise breaking your strategy down into small, actionable blocks, rather than making a top-down presentation of grand ideas and leaving your underlings to figure out how to implement them.
(Shortform note: In Tiny Habits, Dr. BJ Fogg proposes that the key to changing a person’s behavior is making the change easy enough. This is based on his behavioral model, which predicts that a person performs an action whenever they have an opportunity to do so and the combination of their motivation and ability exceeds a certain threshold. Thus, if the task is hard, they won’t do it unless they’re extremely motivated, and personal motivation can be fickle. But if you make the task easier, increasing their ability to perform it, then they don’t need as much motivation.)
4. Cooperation Shortfall
Kim and Mauborgne observe that organizations often have internal battles to get things done and warn that skeptics who resist your strategy can rob the movement of momentum. They recommend doing three things to mitigate this threat:
1. Add a “consigliere” to your strategic management team. As the authors explain, a consigliere is a person who knows the inner workings and politics of your company from firsthand experience. It’s someone who can provide you with valuable insight regarding who is likely to support or oppose your plan and advice on how to swing corporate politics in your favor.
(Shortform note: In The 48 Laws of Power, Robert Greene emphasizes the importance of gathering intelligence through “spying.” He says that knowing your opponents’ secrets allows you to predict their behavior and ultimately control them. He suggests that if you engage with people in a friendly, interested manner, in a social setting, they will often reveal their interests, plans, and even weaknesses. If you are too well-known as the backer of the coming changes for opponents to open up to you directly, your consigliere can serve this function of finding out how people really feel.)
2. Mobilize a broad base of support before your detractors can get organized. This means finding out who your supporters and detractors are likely to be and getting your supporters on board with your plan.
(Shortform note: In The 48 Laws of Power, Greene advises that timing is everything. If the opportunity to make strategic changes hasn’t arrived yet, keep a cool head and wait for it patiently, but when the time comes, and your vision gathers momentum, implement it decisively and be prepared to ride out reactionary opposition.)
3. Understand your opposition’s concerns, and present solutions or supporting data to address them. Aim to present solutions that will allow everyone to be satisfied, but also prepare to counter the likely objections you’ll get from your detractors—anticipate their objections and collect facts and rationale for overcoming them.
(Shortform note: In The 48 Laws of Power, Greene asserts that it’s easier to convince your skeptics through demonstrations than by arguing with them. They may doubt the validity of your data or your proposed solutions, but they can’t argue with actual results. If their objections aren’t valid, sometimes just making a pretense of addressing them in your strategy will pacify them for the time being, and when their concerns are never realized, they’ll think you must have addressed them adequately.)
Align Your Partners
Finally, there may be stakeholders external to your organization that you need to align with your vision in order to make your blue ocean strategy a success. To reinforce the importance of this consideration, the authors cite the examples of Napster and Apple’s iTunes Store.
In its day, Napster was clearly a blue ocean venture. Kim and Mauborgne point out that it offered unique digital music-sharing capabilities with clear user value (free music). It also was in a position to benefit from network effects and had a clear first-mover advantage with over 80 million users. However, the ultimate success of Napster’s strategy was contingent on the cooperation of record label companies. As the authors report, Napster’s management failed to realize this, and instead antagonized the record labels. Ultimately they retaliated with insurmountable lawsuits, and Napster was forced to shut down its service in 2001.
Kim and Mauborgne describe how, two years after Napster shut down, Apple partnered with the five major record labels to offer their content digitally through the iTunes Store. Because Apple recognized the importance of getting these external partners on board, it was far more successful than Napster could be.
(Shortform note: The original iTunes Store offered a similar (though not identical) strategy curve to Napster’s service. Because of this, it’s easy to isolate the difference in how each company managed relations with the record label companies as the key difference that determined Apple’s success over Napster’s, illustrating the importance of aligning your external stakeholders. Moore echoes this message, pointing out that business partners and allies are essential to your success, because the product you produce is usually only a piece of the complete solution to the problem your customers want to solve, and it’s up to your allies to supply the other parts of the solution.)