1-Page Summary
Freaknomics: A Rogue Economist Explores the Hidden Side of Everything is the book for readers who run screaming at the thought of cracking open a book with the word “economics” in the title. When most readers think economics, they think advanced math, complicated models, and subjects like unemployment, the stock market, and the trade deficit.
In Freakonomics, authors Steven D. Levitt and Stephen J. Dubner take a different approach. They use economics to, as the title says, “explore the hidden side of everything.” They argue that economic motivations determine much of human behavior, and demonstrate that economic analysis can be applied to a wide range of problems in the real world.
This approach to economics is empirical, not theoretical.
Throughout, the authors emphasize some key themes.
The Power of Incentives
Simply put, human beings are self-motivated creatures. They are driven by their desire to get what they want, and they will always look for ways to achieve their ends by the easiest or least-costly means.
Therefore, proper incentive design is key, and poorly designed incentives often misfire. For example, it might seem like a great idea to hold individual teachers accountable for their students’ scores on standardized tests—until that incentive drives those same teachers to start cheating on behalf of their students!
Not all incentives are purely monetary. There are economic, social, and moral incentives, and they all exert a powerful grip on human behavior. The key for economists and for those who wish to move public policy in a certain direction is to harness the power of incentives to make them work toward some desired goal.
Beware Conventional Wisdom
Conventional wisdom is easy to understand, comforting, and confirms our own preconceived notions—it’s not necessarily correct. Conventional wisdom held that violent crime would keep soaring through the 1990s and into the 21st century, as it had in the decades before, except it didn’t. Conventional wisdom says that money is the decisive factor in elections, but it’s not.
Tune Out the Experts
Supposed “experts,” like the talking heads on TV or even your doctors, aren’t neutral, unbiased actors, motivated solely by their desire to put their knowledge to work for you. They’re fallible human beings, just as motivated by incentives and guided by conventional wisdom as everyone else.
Instead of listening to these “trusted” sources of information, Freakonomics argues that we should apply rigorous data analysis to get a better picture of what’s really going on.
Information Can Be Abused
Information asymmetry describes situations where information is unequally distributed between parties. Experts rely on knowing more than the other party to extract value from others.
For example, you might think that your real estate agent has your best interests at heart. The more she sells your home for, the larger her commission will be. But she’s actually using her vastly superior knowledge of the real estate market to get the best deal for herself, often at your expense. With her information advantage, she can convince you that a lowball offer on your house is actually a good one and encourage you to quickly sell your house below-market, so she can pocket her commission and move on to her next client.
Other common situations where one party has significantly more information include:
- Doctors recommending treatments that pay more without yielding better outcomes.
- Policy makers pushing policies that benefit some groups at the expense of general society.
- Employers negotiating your salary.
In all of these situations, the layperson (patient, citizen, employee) is at a considerable information disadvantage relative to the expert (doctor, lobbyist, employer). Freakonomics brings a critical lens to these transactions and shows how information can be wielded as a weapon.
Analyze Data to Find the Truth
It’s a messy world out there. Human behavior often seems irrational and unpredictable, with no guiding principle driving or explaining any of it. To pierce through the haze of conventional wisdom, self-interested experts, and information asymmetry, look to data analysis. People can lie and cheat, but it’s a lot harder for numbers to. Using tools from economics like regression analysis, we can make a little more sense of why events unfold the way they do.
Effects Have Distant and Surprising Causes
Seemingly small events can have powerful ripple effects across vast distances of space and time. Something as routine as one woman seeking an abortion in the early 1970’s may have been the catalyzing event for a nationwide reduction in violent crime—twenty years later. As the old adage goes, big doors can swing on small hinges.
Introduction
Are we right to accept the opinions and recommendations of experts? Are there perhaps deeper mechanisms at work that might explain why human beings behave the way they do and why events unfold as they do? In fact, much of the conventional wisdom we have come to accept is false.
The Missing Crime Wave of the 1990s
As the decade of the 1990s dawned, the US airwaves were awash with experts claiming that a new crime wave (far more terrifying than the just-passed crime wave of the 1980s) was on the horizon, to be driven by a fresh cohort of violent, amoral young “superpredators,” who would soon be entering the prime years of their criminal careers.
Except that the crime wave just...never happened. In fact, a historic drop in crime would be a hallmark of the period beginning in the 1990s and lasting through to the present day. In a later chapter, we’ll discuss how data and analysis were used to unpack this misconception.
What Are Incentives?
At their most basic, incentives are stimuli that encourage “good” behavior and discourage “bad” behavior. (Think of how you might give a dog a treat for sitting when she’s told to). As we’ll see throughout Freakonomics, incentives are a key driver of human behavior.
Incentives create an entire mental framework in which human beings think and act. Understanding them enables us to better understand the choices people make. Choices that seem perplexing on the surface often look perfectly rational in light of hidden incentives.
The Folly of Experts
We tend to put our trust in experts—be they doctors, politicians, or even real estate agents and car salespeople. We heed their advice because we accept that they will use their superior knowledge to help us.
Unfortunately, this is often not the case. Experts are motivated by incentives as much as anyone. Doctors might order expensive and medically unnecessary procedures to boost their bottom line. Real estate agents might manipulate you into accepting a weak offer on your house because it’s not worth their time and money to negotiate for a better deal on your behalf.
Understand the incentives of experts, and you’ll understand how they can act against your best interest.
How Do We Find The Truth?
We apply the analytical, quantitative methods of economics. Economics has a powerful toolkit that can be used to solve problems far beyond predicting stock market trends or forecasting GDP.
We see this in the pervasive influence of false correlations. Experts are adept at dubiously linking correlations to causes—it’s one of the most common means by which they spread misleading conventional wisdom. For example, stock market pundits point to questionable causes of movements that might largely be random. Data-driven methods like regression analysis, however, can expose this weak logic and point us closer to the truth.
Does Money Really Buy Elections?
Consider the idea that “money buys elections.” Political scientists (and, perhaps more importantly, self-interested political fundraising consultants) tell us that the candidate who raises the most money wins the election the vast majority of the time. And on the surface, that’s true!
But does the cash really cause the candidate to win? Or is this merely a correlation - are those candidates who are likely to win anyway (because they’re powerful incumbents or because they possess strong appeal) just more likely to receive contributions from donors who want to be on the winning side?
As it turns out, data analysis can shed some light on this. By analyzing elections in which the same two candidates ran against each other in consecutive races, we can create a natural experiment, controlling for political appeal of the individual candidates, the partisan lean of the district, and other potential confounding variables, to focus solely on the effects of money.
The data shows that fundraising makes very little difference toward election outcomes. Winning candidates can raise half as much money and lose only 1 percent of their support, while losers can double their spending and only gain that same 1 percent of additional votes. Good candidates simply raise more money and bad candidates don’t.
Chapter 1: The Power of Incentives
Economics is the Study of Incentives
There are three main kinds of incentives:
Economic Incentives
This is the type we’re most familiar with. Economic incentives provide tangible rewards to people for engaging in productive behavior and penalties on people for destructive behavior. Getting a raise at work for exceeding expectations, a speeding ticket, or even being sentenced to prison (which deprives one of one’s freedom and livelihood), are all economic incentives.
Social Incentives
Social incentives are rooted in our natural desire to be looked upon favorably by others. On the flip side, we fear being shamed and looked upon disfavorably by our peers. To harness social incentives, many jurisdictions in the US have started publishing the names and photos of people arrested for prostitution-related offences—likely a far stronger deterrent than a $500 fine!
Moral Incentives
Most of us want to do what we consider to be “right,” and avoid doing things that we consider to be “wrong.” Thus, there is a powerful moral incentive against committing crimes or engaging in any behavior that causes harm to others. Uniquely, moral incentives are self-enforced—only we as individuals can hold ourselves accountable on moral grounds.
Incentive Design is Critical
Because incentives are effective, economists are fond of devising incentive-based solutions to real-world problems. Unfortunately, people acting in bad faith will always try to “game” or abuse the incentive to gain an advantage. Poorly designed incentive systems can backfire completely and produce unintended, destructive behavior.
Therefore, incentives need to be well-designed. Properly designed incentives promote the intended behavior without allowing people to profit from unintended behaviors. We’ll cover three key examples of how well-meaning incentives caused unintended consequences.
Example: Parents Late to Daycare Pickup
A day-care center requires parents to pick up their kids by 4PM. But inevitably some parents are late. This is costly—the kids are anxious, and the teachers have to stay late to watch the kids. How do you fix this with incentives?
Here’s a simple fix: fine a parent each time they’re late. Theoretically, this increases the punishment to a parent for being late, which should decrease late arrivals.
A pair of economists put this to the test a ta group of day-care centers in Israel. The rule: any parent over ten minutes late would pay $3 per child for each late arrival.
The result was counterintuitive—the number of late pickups doubled. This is odd, since adding an extra fine should decrease pickups! What happened?
It turns out that adding a fine changed the nature of the relationship. A social/moral incentive was converted into an economic incentive. Previously with no fine, parents were held to social standards to be on time (“if you’re a good parent and a thoughtful person, you’ll be on time”).
But when the day-care center added dollars to the mix, it changed the implicit agreement, making the calculation financial, rather than social/moral. It seemed as though the day-care center were saying, “it’s fine for you to be late, as long as you pay $3 each time.” Parents could weigh the value of their time and decide $3 was well worth being late.
This illustrates the tricky, counter-intuitive nature of incentives—well-meaning incentives can have unintended consequences.
(You might suspect that $3 isn’t enough, and that a higher fee like $50 would be more effective. This is likely right, but it might also increase resentment and cause parents to switch to another day-care.)
Example: Teachers Cheating on Standardized Tests?
In the late 1990s and early 2000s, the US federal government and several states began enacting laws mandating “high-stakes” testing. This was an incentive system that:
- Rewarded schools whose students performed well with additional funding and raises for teachers
- Punished schools with low student test scores by cutting funding and firing teachers and administrators.
The idea was to incentivize schools to raise their academic standards. If teachers had a personal stake in the performances of their students, then they would work harder to promote strong test results—right?
Well, teachers did raise their students’ test scores—but not in the way that policymakers intended. High-stakes testing created a massive incentive for teachers to cheat on behalf of their students by granting unwarranted extra time on tests, giving away answers, or even changing incorrect answers. And given the incentive, this behavior makes sense. If they could earn a $25,000 raise by boosting their class’ test scores (and avoid getting fired if they didn’t), there was every economic incentive to give their students a “leg up.” Besides, who would suspect teachers?
Critics of the policy turned to statistical analysis to prove it. By studying a database of seven years’ worth of test answers from students in the Chicago Public Schools (CPS) system, researchers were able to construct an algorithm that identified certain suspicious answer patterns within a given classroom:
- Low-performing students getting lots of hard questions right.
- For any given student, getting the easy questions wrong and the hard questions right.
- Large classrooms that earned suspiciously high scores in one year, while getting lower scores in the past and future.
It’s unlikely that these answer patterns would come about through honest effort or sheer coincidence. Instead, they were best explained by teacher tampering. When they crunched the numbers, researchers discovered that there was evidence of cheating in over 200 classrooms per year, representing more than 5 percent of all classrooms in the CPS!
After discovering the cheating, administrators retested select classrooms with heavier oversight. As expected, classrooms run by cheating teachers showed a huge score decrease when cheating was prevented. Many of these teachers were fired.
Example: Collusion Among Sumo Wrestlers
Sumo wrestling, the national sport of Japan, carries a deep emotional and spiritual gravity among wrestlers and spectators. Yet we see that rampant cheating and collusion are the unintended consequences of a flawed incentive system. Sumo wrestlers are, after all, human beings just like the rest of us.
Each sumo wrestler is ranked according to their win-loss record in tournaments. Those with the highest rankings earn a handsome living and enjoy great prestige. Those with the lowest rankings earn hardly anything and are forced to serve their superiors. So, clearly, the rankings carry tremendous weight (pardon the sumo wrestling pun).
Wrestlers face 15 opponents during the course of a tournament. If they finish with a winning record (8-7 or higher), they will rise in the rankings. If they finish with a losing record, (7-8 or lower), they are relegated to a lower rank. The 8th win makes all the difference.
A wrestler going into a final match with a 7-7 record has every possible incentive to win, of course. But a wrestler with an 8-6 record has little to compete for, since he will have already secured advancement but is also likely to be out of contention for the overall tournament championship. For such a wrestler, one additional victory has almost no value.
This alignment of incentives and disincentives makes a powerful recipe for collusion. Instead of fighting to win, the 8-6 wrestler might let the 7-7 wrestler have the victory, since it matters so much more to the latter.
Like the CPS case above, when we study the data from over 30,000 matches fought by nearly 300 wrestlers, and then narrow it down to matches fought between 7-7 and 8-6 opponents, we can actually see the numbers telling a story. The data reveals some key findings about these matchups:
- 7-7 wrestlers vastly outperform their predicted win percentages when facing 8-6 opponents (winning close to 80 percent of the time when they would be expected to win about 50 percent of the time).
- When these same wrestlers meet again when neither is on the edge of an 8th win, the 7-7 wrestlers who won the previous match underperform their predicted win percentages (winning only 40 percent of the time, when they would be expected to win about 50 percent of the time).
- When these same opponents meet for a third time, the results match the expected win percentages of each wrestler much more accurately.
So an upset win, followed by a worse-than-expected performance, and concluding with a reversion to the mean. Like the unusual answer patterns in the CPS high-stakes test data, these unlikely win-loss records strongly suggest a quid pro quo arrangement—“I’ll take a dive for you if you take a dive for me the next time.”
The specific economic incentive of that 8th win drove rigging of sumo wrestling matches.
Exercise: Identify the Incentive
If you define the incentive in a situation, you’ll understand the human behavior better.
A bank decides to increase its profit margins and motivate its workforce by creating a new incentive program: employees receive bonuses for having customers open new accounts or sign up for additional products and services. Employees are also threatened with termination if they do not meet predetermined quotas assigned by management. Describe how this incentive structure could end up encouraging bad or unethical behavior.
In your workplace or personal life, do you see any economic incentives that are unintentionally leading to bad behavior? Describe the situation:1) what is the incentive, 2) what is the intended effect, and 3) what bad behavior is it encouraging?
In society, social and moral incentives keep people acting in ways deemed “socially acceptable.” What is a social or moral incentive that you disagree with? How would you instead prefer that people behave?
Chapter 2: Information Asymmetry
Unequal Access to Information
As the world has become more specialized and complex, people have come to rely more and more on experts to guide them through major life decisions. This is largely driven by fear of making a wrong decision that might result in financial ruin or even physical harm.
As we’ve discussed above, however, experts are hardly neutral arbiters of truth who are selflessly devoted to guiding you through the trials and tribulations of a staggeringly complex world. Rather, they are often self-interested, equally fallible humans who seek to use their superior information to gain an advantage on you. This unequal distribution of information between parties to a transaction is known as information asymmetry.
Think of the mechanic who tells you that you need to replace parts of your engine that you’ve never heard of to be able to pass your vehicle inspection. Or the doctor who orders that MRI that you’re not quite sure you needed. Or the car salesperson who insists that you need all of those pricey add-on safety features. All of these experts know perfectly well that you know nothing about their business. Often, your information deficit is their gain, especially if they have strong incentives to profit.
(Shortform example: the 2008 Financial Crisis was another story of information asymmetry. Financiers created products like derivatives and collateralized debt obligations, whose larger implications many investors simply did not understand. When the housing market collapsed, those investors who bought these products were wiped out, while the sellers, who possessed a major information advantage, made a tidy profit.
Note: This is not to say that all experts with an information advantage consciously deceive unknowing victims. There are many fair and well-meaning experts. But a tricky thing about incentives is that they can bias someone subconsciously.)
Example: How the Ku Klux Klan Lost its Information Advantage
The Ku Klux Klan (KKK) is the most infamous domestic terrorist group in United States history. Through violence and intimidation against African-Americans, they were fearsome enforcers of the traditional racial hierarchy in the southern US.
You might remember that the Klan supported violent acts like lynchings to spread their message and intimidate African-Americans. But statistics show lynchings had fallen drastically by the 1920s, when Klan membership was at its peak. This suggests that something besides simple violence was at the root of the organization’s influence and power.
Their secret weapon was information. The Klan relied on its status as a secret organization, giving it a powerful mystique that enabled it to exert an influence far beyond its actual numerical strength. With its operations, rituals, and membership shrouded in mystery, the Klan appeared to be all-seeing, all-knowing, and ever-present. This information asymmetry between the Klan and what the rest of the country really knew about it was a major source of organizational strength.
When journalists Stetson Kennedy and John Brown infiltrated the Klan in the 1940s, they discovered that the Klan’s greatest strength could also be its greatest weakness. In radio shows, they publicized the Klan’s passwords, closely-guarded rituals, hierarchical structure, and titles. They robbed the Klan of its secrecy, erasing its advantage of information asymmetry.
Suddenly, the Klan was no longer an omnipresent force and fearful symbol of white supremacy, but rather, a group of poorly educated and unemployed men who engaged in absurd ritual chanting and bestowed upon themselves laughably grandiose titles like “Grand Dragon” and “Klokard.” No longer intimidated, the American public now had enough information to mobilize en masse against them.
The result? Applications for membership and attendance declined as it became an object of mockery, not fear. The veil of secrecy (and thus, power) had been irreparably broken.
Example: Your Real Estate Agent vs. You
When you’re selling your house, it’s natural to assume that your real estate agent will work hard to secure the best deal for you. After all, why wouldn’t she? The incentive seems aligned: the more she sells your house for, the higher her commission will be, right?
Unfortunately, your incentives aren’t as aligned as you think.
Let’s say you sell your house for $500,000. With the customary 6 percent of the sale price going to the agent, she should be pocketing $30,000 from the deal. But that’s before we consider a few other factors that cut significantly into her final take:
- The buying agent’s fee.
- Her own agency’s fee.
- The selling costs (which are borne by the agent).
In fact, her real takeaway from the deal is more like 1.5 percent, or $7,500. And if you think you can ask for more and want to sell for $520,000? Sure, you pocket an extra $18,800, but your agent would only take home an additional $300. And given that she would have to put in all the extra work, place all the extra ads, and turn away new clients, this hardly seems like a worthwhile reward.
Now here’s where the information asymmetry comes into the picture. Given her vastly superior knowledge of the real estate market, she knows how to exploit your relative ignorance. She’ll work her hardest to convince you that the lowball $500,000 is the best you’re going to receive and that you’d better take it before they withdraw or lower it. Of course, she knows that’s not likely to be true, but she’s more interested in having you making a quick deal than in holding out for a better one.
This contrasts with how real estate agents behave when selling their own homes. When we study the public data of home sales in the Chicago area, we see that real estate agents:
- Leave their houses on the market for 10 days longer than they advise their clients to.
- Sell their houses for 3 percent higher than their clients’ homes go for.
(Shortform note: this is a good example of what’s known in economics and in managerial studies as the principal-agent problem. This arises when a party hired to carry out a task has poorly-designed incentives that lead them to engage in behavior that harms the agent. Think of shareholders of a company hiring a CEO and tying that CEO’s compensation to the company’s stock price. This can create an incentive for the CEO to engage in risky ventures, rush untested products to market, or even falsify earnings figures in order to elevate the stock.)
The Internet: A New Hope?
With so much of the world’s information now available at anyone’s fingertips thanks to the Internet, it has become much more difficult for specialists to use their knowledge to their unique advantage.The Internet has eroded the leverage once wielded by old sources of expertise and empowered ordinary people to make better-informed decisions on their own.
If we want to explore how the Internet has helped to bring once-powerful information monopolists to heel, a great example is the term life insurance industry. Term life insurance is a relatively commodified product, with most policies offering the same coverage as those offered by competitors. With little differentiation, customers tend to make their decisions based on price alone.
Before the Internet, it was time-consuming, confusing, and expensive for customers to do price-comparison shopping on term life insurance policies. They did not have adequate access to information to be able to compare products and did not understand the differences between policies. Naturally, this put customers at a considerable disadvantage relative to the insurance carriers. With such an information gap, insurers were free to overcharge customers for routine policies and the customers had little recourse.
Until the Internet. In 1996, Quotesmith.com published the prices of term life insurance policies sold by dozens of companies, along with simple breakdowns of the coverage offered by each. Now, a process that had been laborious and costly became easy and cheap. Anyone could simply click on a website and compare insurance quotes side-by-side.
The result? Insurance carriers had no choice but to lower prices to compete—customers paid $1 billion less for term life insurance in the years afterwards.
Exercise: Overcome the Information Gap
In information asymmetry, whoever has more information has more power.
Can you think of a major public issue or event where information asymmetry is a factor? Explain how an information gap is at play.
Have you ever been in a situation where someone had more information than you and it caused you to feel at a disadvantage? Briefly describe what happened.
Moving forward, how can you enhance your information to put yourself in a stronger position in your personal and professional lives?
Chapter 3: Trust the Data
The Trouble with Conventional Wisdom
Experts are major purveyors of conventional wisdom. Conventional wisdom comprises those beliefs or ideas that are commonly accepted, regardless of their truth or predictive value. It is an impediment to actual knowledge and discovery, often motivated by a mix of self-interest, convenience, and a desire to avoid dealing with the actual complexity of the world. Conventional wisdom is often anecdotal and is rarely backed up by hard, quantitative data.
The Myth of the “Crack Millionaires”
Let’s set the stage. The 1980’s were marked by a tide of rising crime in The United States. A great deal of the violence in the inner cities was driven by crack-cocaine. According to one study, crack accounted for a shocking 25 percent of homicides in New York City in 1988.
It was in this context that the conventional wisdom of “crack millionaires” was born. The myth was largely propagated by police officers, criminologists, and others in the law enforcement community. They argued that dealers were making money hand-over-fist and living extravagant, luxurious lifestyles. Furthermore, these experts warned, the profits from crack dealing were enabling the gangs to purchase state-of-the-art weaponry that left police officers outgunned.
You can see the powerful incentive for law enforcement to perpetuate this myth: by conveying the grave threat posed by crack, police could gain political support for more police resources. The only problem was that the story wasn’t true.
(Shortform note: Don’t take any of this to mean that law enforcement knowingly spread falsehoods about the earnings of crack dealers—there’s no evidence of that, and what they were saying publicly was likely a reflection of the best information they had at the time. Nevertheless, it certainly was a convenient story for law enforcement to keep alive.)
An Economist Crunches the Numbers Behind Crack
So how was the false narrative about crack revealed? Through careful data analysis, this time by an enterprising graduate student at the University of Chicago named Sudhir Venkatesh.
In the early 1990s, Venkatesh decided to study the phenomenon of crack-cocaine by leaving his ivory tower and actually speaking directly with crack dealers in Chicago’s housing projects.
In the course of his work with the Black Disciples gang, Venkatesh gained access to the gang’s financial records. What Venkatesh saw in those records thoroughly refuted the prevailing wisdom.
Analyzing the gang’s financial records, he discovered that crack dealing was only lucrative for the highest levels of the gang leadership. The trade was organized along a highly structured, hierarchical business model:
- At the top was a “Board of Directors” (yes, this was their actual title), the upper echelon of Black Disciples leadership, usually consisting of about 20 individuals at any given time.
- Below that were regional leaders who paid the Board 20 percent of the revenues earned from crack sales, simply for the right to operate within a designated zone of the city. In other words, regional leaders were franchisees, similar to an owner of an individual Burger King location.
- Underneath the regional leaders was a small cadre of “officers,” who ran enforcement, handled the gang’s finances, and oversaw drug transportation and logistics.
- Reporting in to the officers was a corps of between 25-75 “foot soldiers” who handled street-level sales.
- Finally, at the lowest level of the pyramid, was the “rank-and-file,” a large cohort of roughly 200 young men who made no money themselves, but actually paid the gang for protection from rival gangs and for the opportunity to land jobs as street dealers.
Spread out across the city, this hierarchy created a highly unequal pay structure with slightly over 100 upper management leaders earning six-figure salaries, with the remaining 20,000 rank-and-file earning less than minimum wage.The conventional wisdom about “crack millionaires” was wildly misleading—the vast majority of people in the crack trade would have made better money working at McDonald’s. Combined with the extraordinary risks of either death by homicide or a lengthy incarceration in federal prison, it hardly seems like a career anyone would want.
This led to another mystery - if pay was so poor, why were so many young urban men leaping at the opportunity to get into the crack business?
The best explanation is that it was perceived, at least initially, as a quick path to glamour and wealth, particularly in black, inner-city communities that had been hammered by deindustrialization in the 1960s and 1970s. With a lack of opportunity elsewhere, becoming a crack dealer was a decent career option.
In fact, the business did have a lot in common with the so-called “glamour professions,” like movies, sports, music, and fashion—namely, a large pool of people competing for a small number of lucrative positions. Thus, the low earnings for rank-and-file gang members were a consequence of basic supply and demand—namely, a glut in the labor market that drove down wages for everyone.
Exercise: Confront Conventional Wisdom
Be skeptical of conventional wisdom - what everyone believes might be wrong.
What’s a piece of conventional wisdom that you used to believe in? How did you come to realize that it was incorrect?
Building on that experience, what conventional wisdom do you still put stock in today? If you’re beginning to think that it’s wrong, how can you investigate it to get closer to the truth?
What is an example of a widely-accepted belief that you think is wrong? Why do you think this belief is incorrect?
Chapter 4: Big Effects Can Have Small Causes
(Shortform note: this chapter discusses the dramatic and unexpected fall in US crime rates beginning in the early 1990s, examining a number of popular theories for why this happened before proposing an alternative, and quite counterintuitive, explanation. As we’ll discuss later, the authors’ theory has become controversial since the initial publication of Freakonomics.)
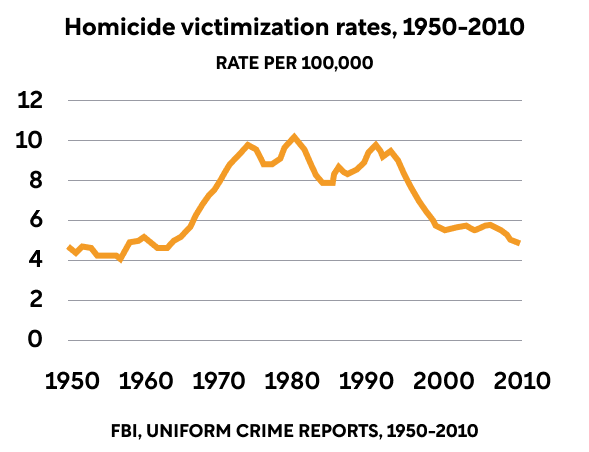
The Rise and Fall of Crime
We discussed the crack-fueled violence of the 1980s in the preceding chapter. But crack was just one part of an alarming rise in violent crime that had begun in the 1950s and continued for a generation. In 1989, violent crime in America was at a peak, having risen 15 percent since 1975.
Criminologists and law enforcement personnel warned the public that these trends would continue well into the 1990s and beyond. But this also proved to be wrong.
Beginning in the mid-1990s, crime began an unexpected and precipitous decline, dropping to levels not seen since the 1950s. The much-predicted (and much-feared) rise in murders, rapes, burglaries, and assaults simply failed to materialize.
Why Did This Happen?
Experts cited six main explanations for the phenomenon:
- Economic growth
- More incarceration/capital punishment
- Putting more cops on the streets/innovative policing strategies
- Gun control
- Aging of the population
- Structural changes to crack markets
It’s a standard economics approach to investigate each hypothesis, looking for data to support or contradict the theory.
As we crunch the numbers below, however, all these theories added together don’t come close to accounting for the falling crime rate. Furthermore, the list leaves out a major (and surprising) cause of the phenomenon. We’ll examine each of the conventional theories in turn.
Economic growth?
Some experts argued that the economy improved in the 1990s, leading fewer people into crime.
It is true that the great decline in crime coincided with the 1990s economic boom, but not enough. According to studies, a 1 percent drop in unemployment would be expected to be matched by a 1 percent drop in nonviolent, economically motivated crime.
Unemployment declined by only 2 percent during the 1990s, while nonviolent crime alone plummeted by 40 percent! The economy might contribute a bit, but not enough.
More incarceration/capital punishment?
The idea is that being “tougher on crime” in the 1990s dissuaded people from committing crimes.
It’s true that crime had flourished during a relatively lax period of criminal justice enforcement in the 1960s and 1970s. Conviction rates declined during this era, and those who were convicted tended to serve shorter sentences. If we think back to incentives, we’ll see that the cost of committing crime was relatively low, which encouraged criminal activity.
In response, the public began clamoring for “tough on crime” policies, first with putting more people in jail. The national prison population increased by a factor of 15 from 1980 to 2000, with more than 2 million behind bars by 2000. The mass incarceration theory, while far from being a complete explanation, does have some merit as an underlying cause of the fall in crime. Prison sentencing explains about one-third of the decline in crime.
(Shortform note: after this book was published, a 2015 review by the Brennan Center for Justice argued that incarceration only accounted for just 0 and 7 percent of the reduction in crime during the 1990s.)
Being “tough on crime” also included capital punishment. Proponents of the death penalty argue that it acts as a strong disincentive to crime and that its increased use during the 1990s coincided with the decline in crime.
But the rate of execution is actually quite low. Fewer than 500 people were executed in the US during the the 1990s. Even among prisoners already convicted and on death row, the annual execution rate is only 2 percent. Given the low likelihood of actually facing execution, it doesn’t make sense that criminals would be deterred. In other words, capital punishment is more of an empty threat than a real cost.
More cops/better policing?
Maybe it was driven by putting more cops on the street? From the 1950s to 1980s, police number relative to the number of crimes decreased by 50%. Then there was a 14 percent increase in the number of police officers during the 1990s.
This alone, however, doesn’t prove the causal relationship—in fact, where there are a lot of police, there tends to be more crime (because the public demands more police when crime levels are high). Obviously, police aren’t causing crime, so the true causal mechanism must be more complex than that.
How can we get closer to the real dynamic at play? We look for real-world examples that enable us to conduct natural experiments through which we can which we can test the theory. Of course, we want examples where more police were hired for reasons other than an ongoing crime wave, so as to not confuse cause and effect.
When mayors run for reelection, they often go on a police hiring binge in the months leading up to the election. The data does show that a short surge in police presence is correlated with a drop in crime rates during these brief periods. Research suggests that about 10 percent of the drop in 1990s crime can be credited to hiring more police officers.
If putting more police on the beat isn’t the whole answer, then perhaps it’s about better policing strategies? It might have been quality of policing rather than quantity of policing that helped cut down on crime.
Unfortunately, the data doesn’t bear this story out either. In New York City in the 1990s, Mayor Giuliani hired a new commissioner to revamp the police approach, including using data-driven tools to spot crime and cracking down on petty crime. The results initially looked promising: NYC’s sky-high crime rate plummeted, faster than anywhere else in the country. Murder rates decreased by 72%.
In retrospect, however, this decline in 1991, before Giuliani took office! The NYPD had begun a hiring surge under Giuliani’s predecessor, ultimately growing by 45 percent during the 1990s. When you subtract the effect of these new officers, the city’s performance runs about even with national trends.
Moreover, the decline in crime was a nationwide phenomenon, including in cities that did not deploy cutting-edge law enforcement strategies. The notion that policing quality wasthe main driving factor in bringing down crime seems weak.
Gun control?
Guns make it easier to inflict lethal violence, but whether or not they will be used in a deliberate act of homicide comes down to who is wielding them. Research does suggest the abundance of firearms contributes to the country’s high murder rate: two-thirds of US homicides involve a gun, a far higher percentage than in other industrialized countries.
It would seem, then, that policies that strongly limited the availability and circulation of guns would reduce crime.
Perhaps they would, but the actual policies adopted during the 1990s were a far cry from this ideal, and did little to curb the circulation and supply of firearms.
Take the Brady Act from 1993, which established background checks and waiting periods for buying handguns. However, it failed to crack down on the black market for handguns, where most criminals get their guns. According to its critics, the main effect was to make it harder for law-abiding citizens to access handguns.
Therefore, it’s unlikely 1990s gun laws had any meaningful impact on crime rates.
Structural changes to crack markets?
Since we’ve shown that crack was a major driving force behind the rising violence of urban America in the 1980s, did its subsequent fall in the 1990s have something to do with crack as well?
It did, although like all the other theories, crack is only part of the story. Crack use never actually went away - what did decrease was the violence associated with it.
Why? While there were profits to be made in crack, eventually supply and demand stabilized the market::
- The allure of high profits drove new entrants to the market.
- With more competitors, gangs began undercutting one another on price.
- The price war drove down overall prices.
- The once-high profit margins collapsed.
- Street dealers were paid less, and saw less incentive to commit violent crime for low pay.
As a result, crack violence started to wane, accounting for 15 percent of the drop in crime during the 1990s.
Aging population?
Experts in the 1990s believed the population was trending younger. Since people between age 16-24 commit the most crimes, a younger population would mean more crime.
In fact, this was doubly-wrong. Firstly, the population was actually getting older, not younger, and old people commit crimes much less often. Secondly, even when we account for an aging population, that kind of demographic change is a very long, slow process. It’s unlikely to produce the kind of swift and sudden decline in crime as we saw in the 1990s.
The Hidden Factor: Legal Abortion
So, the seven above factors only account for about 60 percent of the reduction in crime. What about the other 40 percent?
According to Freakonomics, the missing answer was Roe v. Wade’s nationwide legalization of abortion in 1973. Because this happened two decades before the declining crime trend began, it wasn’t top of mind for researchers who came up with the other seven explanations.
Here’s the idea: before Roe v. Wade, women who sought abortions but couldn’t get them were disproportionately likely to be teenage mothers who were poor, single, undereducated, and/or drug and alcohol dependent. In turn, their children (raised in unstable homes) were more likely to become criminals later in life, particularly when they reach the 16-24 age group, which are the peak years of criminal activity.
The numbers are large—by 1980, 1.6 million abortions were performed. And these post-Roe abortions were disproportionately requested by women who fell into the demographic set identified above.
But the real effects of legalized abortion on crime wouldn’t be felt for almost twenty years later. Beginning in the early 1990s, crime started to fall, precisely at the time when these babies aborted following Roe would have been entering their peak crime-committing years. In effect, a large cohort of at-risk children who would have been teenagers in the early 1990s was never born.
The theory is bolstered by research showing that states that had legalized abortion before 1973 saw crime rates drop earlier in the 1990s than those that hadn’t, and states with highest abortion rates in the 1970s saw the largest crime decreases in the 1990s.
(Shortform caveat: in recent years, the outlawing of lead additives in motor fuel in the early 1970s has been suggested as another reason for the crime fall. Since lead exposure has been linked to learning disabilities, low IQ, and poor impulse control, researchers argue that children with a high degree of lead exposure run a higher risk of becoming criminals. This theory also explains why crime rose during the mid-20th century as widespread motorization resulted in more lead exposure by children, particularly in dense urban areas.
Regardless of the ultimate answer, the point of this chapter, in our eyes, is to show the process of using scientific inquiry and data to unravel a complex phenomenon. There is rarely one clear answer, and different causes can have differently-sized effects. Rather than accepting conventional wisdom, examine all the hypotheses, and figure out how likely each is.)
Chapter 5: Correlation vs. Causation
Why We Falsely Link Effects to Causes
When two things happen together, it’s tempting to believe that one caused the other. For example, in the previous chapter, we saw that the economy improved while crime rates dropped. This seems like a satisfying explanation, until the data show the economy couldn’t have had a large effect.
In reality, many correlated phenomena are correlated purely by chance. This gives rise to the well-known saying, “correlation does not imply causation.”
(Shortform note: this underlies a lot of popular superstitions, like people who wear their “lucky hats” to baseball games because they think it helps their team win.)
How Parents Fall Prey to the Correlation vs. Causation Trap
A great demonstration of the correlation/causation trap can be found in the proliferation of popular theories about how “best” to raise children. For years, childcare experts have advocated contradictory and ever-changing theories:
- They used to advocate co-sleeping—now they don’t.
- They used to encourage stomach-sleeping for infants—now, since we know so much more about sudden infant death syndrome, they REALLY don’t.
Because the stakes are so high, parents are highly susceptible to fearmongering and conventional wisdom on childcare. Unfortunately, this leads parents to go to extraordinary lengths and expend vast resources on measures that have a questionable impact on child safety. They purchase expensive car seats, despite their dubious safety record. They forbid their children from playing at homes where guns are present, while ignoring more mundane, but far more likely risks like unfenced pools.
In general, we tend to fear things that seem random, sudden, and unpredictable (even if they are wildly unlikely). It’s why we demand action against terrorism (which you stand almost a zero percent chance of falling victim to), but are blasé about heart disease (which kills over 600,000 Americans annually). It’s why we panic over mad cow disease (a similarly low risk), while being relatively sanguine about global warming (a slow-moving catastrophe that nevertheless threatens to destroy civilization as we know it).
So do parents need to worry as much as they do? Do our efforts as parents even make as much of a difference as we think they do?
Regression Analysis: Breaking Down the Correlation/Causation Fallacy
The Early Childhood Longitudinal Study (ECLS), launched by the US. Department of Education in the 1990s, measured the academic progress of over 20,000 students as they progressed from kindergarten to the fifth grade, interviewing parents and educators and asking a broad range of questions about the children’s home environment. The study provided an ample resource of data that researchers could use to identify more statistically meaningful relationships between specific parenting tactics and children’s academic outcomes.
Researchers used regression analysis to draw conclusions from this rich data set. Regression analysis enables researchers to isolate two variables in a complicated and messy set of data, holding everything else constant to identify relationships between variables. Its main benefit is that it allows analysts to control for confounding variables that might otherwise confuse the true causal relationship.
It is important to note that regression analysis does not “prove” causal relationships. The only way to truly do that would be to set up a randomized, controlled experiment, similar to what would be done in a clinical trial for a new pharmaceutical. This is very hard (if not impossible) to do in a field like economics, where it is highly impractical to create these conditions. Thus, economists use regression analysis to study causative relationships in natural experiments.
According to the ECLS study, these are the factors that were strongly correlated with children’s test scores:
- Having highly educated parents
- Having parents with a high socioeconomic status
- Having a mother thirty or older at the time of her first child’s birth
- Being born with a low birthweight
- Speaking English in the home
- Being adopted
- Having parents active in PTA
- Living in a home with many books
Meanwhile, these factors were not correlated with children’s test scores:
- Coming from a traditional, two-parent home
- Moving to a better neighborhood
- Having a stay-at-home mom between birth and kindergarten
- Attending Head Start
- Regularly attending museums
- Being spanked on a regular basis
- Watching television frequently
- Being read to daily
If you look at the lists of factors above, do you notice a pattern? Most of the traits that correlated with academic performance were immutable characteristics that parents possessed. They were either rooted in the parents’ identity or had to do with things the parents had achieved before they had children. They weren’t active decisions made by the parents.
Accordingly, the traits that weren’t linked to children’s academic performance were things that parents made the deliberate choice to do (like going to museums, reading, limiting TV).
In some ways, this is unsatisfying. We like to focus on what tangible things we can do (like reading to our kids or cutting their TV time), and we like to believe those actions make a difference. In contrast, we don’t like being subject to environmental causes outside our control (like how rich our parents were), because it punctures the idea that we as individuals are fully in control of our own destiny.
But regardless of how we feel, the data speak for itself. Who parents are, what attributes they possess, matters more than what they do. Parenting may not make a difference—but parents most likely do.
Exercise: Determine the Cause
Sometimes, one thing that causes another turns out to be completely unrelated.
Have you ever thought that something was caused by one thing, only to discover that the true cause was actually something else? Describe the situation.
As you reflect on that experience, how might you avoid this kind of confusion in the future?
Chapter 6: What Data Can Teach Us
(Shortform note: this chapter is meant to illustrate what we can learn from applying statistical tools like regression analysis to a rich and large dataset. Like other chapters in Freakonomics, it employs an unusual, counterintuitive, and decidedly non-economic story—in this case, the effect on life outcomes of individuals with black-sounding names—as a framing device for economic principles. When reading the book, it can be easy to get lost in the minutiae of the individual stories, so we reinforce the larger, overarching ideas.)
Natural Experiments and Economics
Economics is not an easy field in which to conduct randomized controlled experiments. Since much of economics focuses on quantities that are very large (national GDP, effects of fiscal policy on employment) and involves the study of individual decisions made by billions of people, it’s rare for economists to be able to test their hypotheses in a lab.
For this reason, economists must observe events in the real world that happen create “variable” and “control” groups that can substitute for the classical design of a laboratory experiment. These real world events are called natural experiments. Throughout Freakonomics, we’ve relied on several such naturally occurring datasets:
- The CPS test scores indicating teacher cheating
- The Chicago home sales data illuminating real estate agent incentives
- The post-Wade v. Roe crime statistics
Raw public data sets are one of the best resources available to economists.
(Shortform note: a good example of this approach within the economics field is a famous 1994 study on the effect of minimum wage on unemployment. Conventional wisdom held that increasing minimum wage would increase unemployment, by raising the price of hiring employees. This would be hard to run an experiment at scale. Instead, two economists studied a natural experiment: New Jersey increased its minimum wage, while neighboring Pennsylvania didn’t. New Jersey thus acted as the variable group and Pennsylvania as the control group. The result: New Jersey’s employment rate did not suffer relative to Pennsylvania’s, even after New Jersey hiked its minimum wage.)
Can People Be Harmed By Their Names? A Public Study Sheds Some Light
In 2004, an economist studied a massive trove of public data, published by the state of California, consisting of birth certificate information for every child born in the state since 1961. The dataset, which encompassed over 16 million births, contained invaluable information for each birth, including:
- Standard information like name, gender, race, and birthweight
- Parents’ marital status
- Economic status indicators like zip code, parents’ means of paying the hospital bill, and parents’ level of education
He used this natural experiment to explore whether or not having a distinctively “black” name had a negative impact on an individual’s life prospects. In other words, would naming your son DeShawn lower his life outcomes compared to naming him Connor, even if you changed nothing else? The point of the study was to unpack the socioeconomic disparity between blacks and whites—might black culture cause economic differences between races? In the case of names, having a blacker-sounding name might unfortunately cause more discrimination in job applications.
Given the impossibility and unethical nature of conducting a randomized controlled experiment on this topic (i.e., forcing two groups of parents to give their children black and non-black names, respectively, and then analyzing the children’s life outcomes), the dataset was the next best thing.
So what did the data show?
Over time, black and white parents diverged in the types of names they gave their children. In 1970, the typical girl in a black neighborhood received a name that was only twice as common among blacks as whites—by 1980, a girl in the same neighborhood would receive a name twenty times as common among blacks. By the 2000s, 40 percent of black girls born in California in a given year would receive a name that not one of the 100,000+ white girls born in the state that year would have. A further 30 percent of black girls receive names that no other babies (white or black) would have.
As a standard for comparison, white, Asian-American, and Hispanic-American parents differ a bit, but nowhere near as much as the white-black difference.
The economist also saw points of commonality between the mothers who were most likely to give their children distinctively black names. They tended to be:
- Teen mothers
- Unmarried
- From low socioeconomic backgrounds
- Have low educational attainment
- Have distinctively black names themselves
This last data point was critical, since it enabled researchers to build another natural experiment.
Combing through the data, they could track the full life trajectory of those mothers who had distinctively black names and compare them against a control group of mothers who didn’t have distinctively black names. Using regression analysis, they could control for other factors that might have influenced these women’s life trajectories like (education, income, or criminal history) and measure the impact of their names.
The research indicated that, all other things being equal, individuals with black names did tend to have worse life outcomes than those with less ethnically distinct monikers.
But as with the parenting factors above, we must not draw causal relationships for which we have no basis. The name is an indicator that is associated with poor outcomes. Absent a formal randomized controlled trial, we cannot establish causality with certainty. As the data demonstrated, the kind of black parents who give their children names like “DeShawn” or “Shaniqua” are disproportionately likely to be poor and suffer from low educational attainment, which makes it likely that this cycle of poverty will manifest in the life outcomes of their children. Despite the trends, the causality is unclear - distinctively black names may be more symptom than cause.
Epilogue: Articles and Supplemental Material
(Shortform note: This section is composed of a series of articles from the New York Times Magazine, including a “Freakonomics” column that ran in the magazine from 2005-2006, as well as select entries from the “Freakonomics” blog that were added to the revised and expanded 2006 edition to the book. These should be viewed as supplemental readings only. They aren’t necessary for understanding the larger themes of the main Freaknomics text, and many of them simply restate or summarize the case studies featured in the original book.
From these articles, you should gain a deeper understanding of why the author’s focus on the stories that they do, how they define their approach to economics, what they think are the main drivers of behavior (incentives), and how data analysis can provide powerful insights into how the world actually works.)
“The Probability that a Real-Estate Agent is Cheating You (and Other Riddles of Modern Life): Inside the Curious Mind of the Heralded Young Economist Steven Levitt” (2003)
This article discusses Levitt’s focus on applying an economic lens and economic tools to explain events and behaviors that are traditionally outside the realm of economics.
His approach has been to take the “dismal” out of the “dismal science” of economics by blending psychology, neurology, criminology, and other fields into the discipline, engaging a wider audience and using economic theories and methods of analysis to provide insight to pressing real-world problems. Fundamentally, Levitt defines his approach to economics as empiricism (knowledge through observation) over theory.
“Up in Smoke: Whatever Happened to Crack Cocaine?” (2005)
This article re-explores some of the themes discussed in Chapter 3 of the main Freakonomics text. As you’ll recall, crack is still quite prevalent, with overdoses actually higher than they were during the height of the crack epidemic of the 1980s. The crack trade has just gotten significantly less violent.
With reduced demand for the product (younger people were turned off to it, having seen its ravaging effects among their elders), there has been a drop in price, as one would expect from laws of supply and demand.
The resulting decline in profit margins reduced the incentive for violence—it’s not worth the high costs and risks associated with killing a rival (or risking getting killed yourself) to gain marginal ground in a less and less profitable market.
“Does the Truth Lie Within? One Professor’s Lifetime of Self-Experimentation” (2005)
This article puts the Freakonomics lens on the self-experimentation of Seth Roberts, a sociology professor at the University of California at Berkeley. Self-experimentation is (as the name suggests) when an individual performs experiments on themselves. Aside from the personal risk associated with doing this, the practice is usually scorned by scientists, since:
- It removes objectivity
- It’s impossible to set up a control group or a double-blind experiment (since the subject and the researcher are the same person)
- It’s difficult to replicate
Nevertheless, Roberts wanted to experiment with how to lose weight. He realized that the human body has an internal “thermostat” or an ideal weight set point to which individuals naturally regressed. This had a sound evolutionary basis. In the Stone Age, when access to food was hardly guaranteed and small tribal groups went through periods of great abundance followed by unforgiving scarcity, the body had to learn to adjust hunger levels to fit the relative availability of food at a given time.
Thus, our body sends intense hunger signals when there is lots of tasty, familiar food around (as there is in most wealthy, industrialized societies of the 21st century) and sends the opposite signal when food is unavailable or unappealing. In a wealthy society like the US, our bodies are sending us the “wrong” signals. Big Macs beget more Big Macs.
The key, then, is to “game the system” by tricking our bodies into telling us we’re not hungry.
Through self-experimentation, Roberts achieved this effect by consuming a few tablespoons of oil per day, giving him some extra flavorless calories that tricked his body into being less hungry. The result? He lost 40 pounds which he has never regained.
Self-experimentation suffers from inherent flaws that requires its results to be viewed with skepticism. Still, we shouldn’t completely ignore what it tells us. Sometimes self-experimentation is the fastest, or only, way to get an interesting result to an interesting question.
“Curbing Your Dog: Can Technology Keep New York City Scooped?” (2005)
Given the low penalties and infrequent enforcement, why do so many dog owners pick up after their dogs? Well, think back to Chapter 1. It’s not because of economic incentives—it’s social incentives. While a $50 fine may not constitute a severe financial penalty, being seen as a selfish and irresponsible dog owner is a powerful source of shame that does compel people to obey the law in this case.
“Why Vote?” (2005)
Economists talk often about the “irrationality of voting.” Since any singe vote is highly unlikely to affect the outcome, the cost of voting to an individual (in terms of lost time, foregone wages, and travel costs) isn’t one worth paying. Outside of some self-satisfaction for performing your civic duty, you don’t “get” anything for showing up to the polls. So why bother voting?
(Shortform note: if everybody followed this logic, then nobody would vote, which would be a bad outcome for democratic societies.This is related to the idea of the “tragedy of the commons,” where rational, self-interested behavior by an individual becomes destructive when exercised collectively.)
The implementation of a vote-by-mail system voting in Switzerland presented a natural experiment that enabled political scientists to study whether voter participation would increase once people could avoid paying the costs of voting in person. The natural experiment was especially useful, since vote-by-mail was not implemented uniformly across the country, but rather, on a district-by-district basis, enabling researchers to treat districts where it had been implemented as a variable group and districts where it had not yet been implemented as a control group.
The results? Turnout actually declined!
It turns out that the social incentive to vote (i.e., not being seen as a slacker citizen by your community) is actually quite high. By being seen showing up in person at the polls, you can avoid the social penalty. With the anonymity of vote-by-mail, however, more people took the liberty to stay home, since the cost of nonvoting had been reduced. If you weren’t seen voting, you could just say you had voted by mail. This should give pause to those who point to Internet voting as a means to boost turnout—the Swiss experience would suggest the opposite effect.
“The Economy of Desire: Can Fear of AIDS Change Sexual Preference?” (2005)
Outside of prostitution, we don’t typically think of sex as having a price. Economists would beg to differ.
In economics, prices encompass much more than the dollar amount on the menu. They consist of opportunity costs (the costs of the foregone alternatives as a result of a decision: think giving up your job to go to college), as well as social and moral costs.
The epidemic of HIV/AIDS among gay men in the 1980’s, could be said to have drastically (and lethally) raised the cost of male-male sexual contact. Would people respond to this “cost increase” by demanding less?
According to a study from the University of Chicago, they did. In a 1992 sexual behavior survey of more than 3,500 people, those who had a relative with HIV/AIDS were far less likely to have had sex with men—this was true for both men AND women.
- None of these men reported having had sex with a man within the previous five years, nor did any of them cite homosexual preferences.
- Perhaps more startlingly, self-reporting of homosexuality among women in this category was twice as high as those who did not report having a relative with HIV/AIDS.
The absence of homosexuality among these men and the overrepresentation of it among these women would seem to suggest that this subset was frightened off the idea of sex with men in general, by knowing someone suffering from HIV/AIDS.
“Filling in the Tax Gap: Why Americans should be clamoring for the IRS to do more audits, not fewer” (2006)
Why do Americans pay their taxes?
Because most Americans have a powerful incentive to comply, for fear of a potential (and painful) audit by the IRS. This is especially true for wage earners who file a W-2 form (in other words, 90 percent of American taxpayers). For these filers, their employer has already reported their income to the IRS and taxes have already been withheld from their paychecks. Cheating on your taxes in this situation is very dangerous, since you run a high risk of being caught.
Unsurprisingly, tax compliance is very high among W2 filers (only about 1 percent of income from this group goes unreported, according to IRS data).
Contrarily, those who are self-employed underreport far more than wage and tip-earners. Here, the incentives work in the opposite direction. If you’re a business owner or independent contractor, you’re the only one who knows your income. The only way the IRS could discover a discrepancy in your filing would be for them to audit you. Given the overtaxed (pardon the pun) resources of the IRS, this is unlikely. Thus, the relatively low risk of discovery creates a stronger incentive for self-employed individuals to cheat.
Exercises: Apply Freakonomics
Think like an economist in everyday life.
In a few sentences, explain how experts use information asymmetry and correlation/causation fallacies to mislead people. Please cite examples from Freakonomics.
How might an incentive backfire if it is poorly-designed? Please cite examples of bad incentives from Freakonomics.
What is your most important takeaway from the book? How can you model your future thinking to reflect what you’ve learned?